Eric Kuhn, Rin Tara, John Fleck
The pending Northeastern Arizona Indian Water Rights Settlement Agreement settles Navajo Nation, Hopi Tribe, and San Juan Southern Paiute Tribe claims to the Upper Colorado River Basin in Arizona. To do so, Arizona’s 50,000 AF entitlement of Upper Colorado River Basin water will be allocated.
Although Arizona’s testimony during the ratification of the 1948 Upper Colorado River Basin Compact indicated that Arizona’s cut would be used for tribes, Arizona fashioned the deal to benefit the Central Arizona Project. Charles A. Carson, Arizona’s Upper Basin Compact Commissioner, originally requested 136,200 AF/yr for Arizona in the negotiation but ultimately accepted 50,000 AF/yr in the interest of sweetening the deal for the rest of the states to sign on to stream depletion theory as the means for measuring system use. Stream depletion theory, under Arizona’s interpretation of the 1922 Colorado River Compact allowed Arizona to consume two million acre-feet per year on the Gila River system, while only being charged for one million acre-feet of compact apportionment.
This theory, in combination with the Upper Basin relationships strengthened by Carson’s choice to accept only 50,000 AF/yr, is what Carson envisioned would be used to convince Congress Arizona had a sufficient legal water supply for the Central Arizona Project. The CAP project was approved in 1968 and completed in the 1990s, though tribal water in Arizona’s northeast corner was not quantified. Even after CAP was built, a portion of the power generated at Navajo Generating Station, which consumed a significant portion of that 50,000 AF/yr apportion, powered the pumps that transported CAP water from Lake Havasu to central Arizona.
Eight decades after Arizona acknowledged that the 50,000 AF of Upper Colorado River Basin water was destined for tribes, Congress is on the cusp of approving the settlement that would resolve some water rights for Navajo Nation, Hopi Tribe, and San Juan Southern Paiute Tribe. This settlement is critical and long overdue, especially considering Arizona’s acknowledgement of tribal entitlement in the 1940s.
The “backstory” behind Arizona’s 50,000 acre-feet of Upper Basin water.
At the recent Water Education Foundation Colorado River meeting in Santa Fe, we heard an update on the status of Congressional approval of the water rights settlement among Arizona the Navajo, San Juan Southern Paiute and Hopi nations. Among other things, the settlement divides up the use of the 50,000 acre-feet of water apportioned to Arizona by the 1948 Upper Colorado River Basin compact. How Arizona ended up with 50,000 acre-feet of Upper Basin water is a fascinating story. At first blush, it may seem somewhat arbitrary, but the reality is that it was based on a well-conceived and executed strategy by Arizona’s negotiators At the time, the deal was cut, Arizona’s negotiator made clear that the only likely users of the water would be Native American communities in northeast Arizona. The deal was not designed for their benefit, but rather for the ultimate benefit of Arizona’s quest to build the Central Arizona Project.
While Arizona’s motives may have focused entirely on cutting an interstate deal to enable construction of the CAP, the state’s leadership were frank in acknowledging that the only people who might put Arizona’s Upper Basin allotment to use where Native Americans.
“There is not much possibility of using water on that land except … on the Navajo Reservation,” Arizona’s Charles A. Carson told members of Congress during the 1949 Upper Basin Compact hearings.
The 1922 Colorado River Compact divides the basin into two sub-basins: the Upper Basin and the Lower Basin. The dividing point is Lee Ferry, located in Northern Arizona, a mile downstream of the confluence of the Colorado and Paria Rivers. Lands that drain into the Colorado River above Lee Ferry are in the Upper Basin, including about 7,000 square miles of lands in northeastern Arizona. Today all but a small portion of these lands are located on the Navajo reservation. Likewise, both Utah and New Mexico have lands that drain into the river below Lee Ferry. The Upper Gila River in New Mexico and Kanab Creek and the Virgin River in Utah are Lower Basin streams.
Although Arizona has lands in the Upper Basin, it is not a State of the Upper Division, a critically important distinction under the 1922 Compact. As a state with Upper Basin lands, Arizona in entitled to use some portion of the beneficial consumptive use apportioned to the Upper Basin under Article III(a) of the 1922 Compact, but since it is not a State of the Upper Division, it does not share in the joint obligations of the Upper Division States to provide certain flows at Lee Ferry under Articles III(c) and III(d). This is a nuance the negotiators of the 1948 Upper Basin Compact understood from the get-go (UCRBCC Official Record, 1st meeting, pages 25-26).
Arizona’s Upper Basin Compact Commissioner was Charles A. Carson. He was the state’s special counsel for Colorado River matters. Carson, an accomplished lawyer and skilled negotiator, began representing Arizona in the mid-1930s. By the 1940s, Arizona’s top water priority was obtaining Congressional approval of the Central Arizona Project (CAP). Carson negotiated the 1944 contract between Arizona and the United States for 2.8 million acre-feet of Hoover Dam water. He orchestrated his state legislature’s ratification of the Colorado River Compact a few weeks later. In 1945 he chaired the legal sub-committee of the Six-State Committee that successfully lobbied for Senate ratification of the 1944 Water Treaty with Mexico. During this time, he became a close associate and friend of Colorado’s Clifford Stone and Royce Tipton. Stone was Colorado’s Upper Basin Compact Commissioner, its first Executive Director of the Colorado Water Conservation Board, and the long-time chair of the Committee of Fourteen that advised the U.S. State Department on the treaty negotiation with Mexico. Tipton was a consulting engineer that worked for Colorado on four major interstate compacts. He was an engineering consultant to the State Department during the negotiations of the 1944 Treaty. With Stone’s blessing, Carson hired Tipton to help with Arizona’s efforts to advance the Congressional approval of the CAP.
Carson’s appointment as Arizona’s Upper Basin Compact Commissioner was likely welcomed by the negotiating teams from the other states. He was designated as Chair of the Commission’s Legal Committee, which would ultimately make numerous recommendations to the Commission on the language and structure of the Upper Basin Compact. Among the many important recommendations the legal committee made were the decisions to include the water requirements of the Upper Basin’s tribes within the apportionments made to each individual state (rejecting an option by New Mexico to consider the tribal needs as a “sixth state”) and the language of Article IV which prescribes how the UCRC will determine the timing and amount and distribute among each Upper Division State a curtailment (aka – “compact call”), if necessary to be in compliance with 1922 Compact.
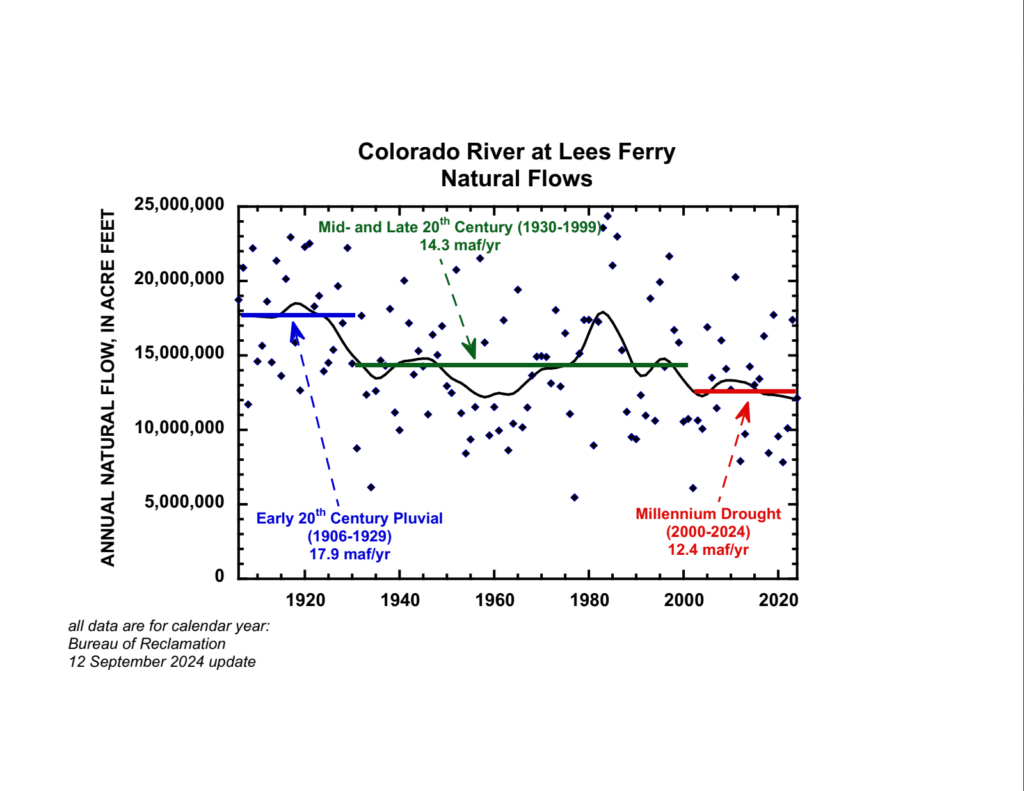
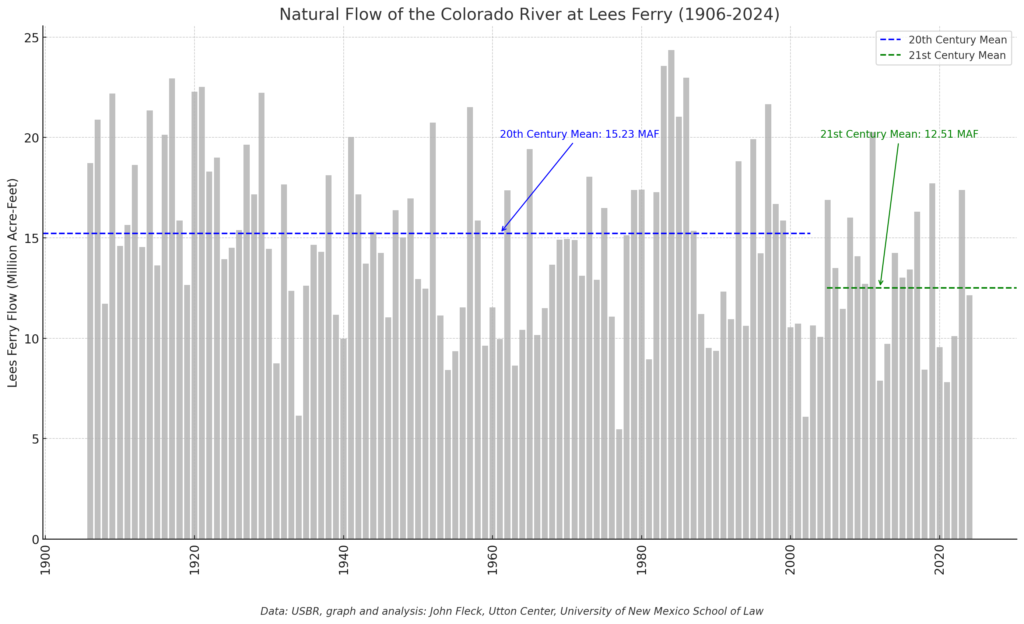
Carson first spelled out what Arizona wanted from an Upper Basin Compact during the second meeting of the Upper Basin Compact Commission in September 1946, almost two full years before the other four (?) states put their cards on the table during the marathon seventh meeting in July 1948. Carson suggested Arizona be apportioned “all of the waters (on its Upper Basin lands) precipitated thereto, and in addition thereto, 1000 acre-feet from the Paria River” (Official Record, 2nd meeting, page 4). When the other states were finally ready to negotiate the allocations (Colorado had insisted that the Commission not address this core issue until the Engineering Committee had completed its report), Carson reiterated his request–Arizona wanted the right to use all the water that fell on its lands as precipitation plus an additional thousand acre-feet from the Paria River. Now that the Engineering Committee had completed its report, this number was now quantified–136,200 acre-feet (Official Record, 7th Meeting, page 69). According to the Engineering Committee, these 136,200 acre-feet represented 0.87% of the natural (virgin) flow at Lee Ferry (Official Record, 7th Meeting, page 22). This number may seem very high based on our recent experience, but it was the number the Commission had in front of it and in the 1940s the estimated natural flow of the river at Lee Ferry was about 16 million acre-feet per year.
The problem facing the Commission was that collectively the states had requested a total of 117% of the available water. Since Arizona had requested a fixed amount, the problem was with the four Upper Division States, but that did not prevent the other states from suggesting that Arizona consider taking less. Wyoming’s legal advisor Bill Wehrli asked Carson if Arizona would accept an apportionment of 49,200 acre-feet. Carson responded, “I am willing to do that in order to try to help make a compact.” Interestingly, Wehrli responded, “we would be willing to be a little more generous and give you one percent” (7th meeting, page 109). The 49,200 acre-feet referenced by Wehrli was taken from the 1947 comprehensive basin report prepared by the Bureau of Reclamation. The report included very little detailed backup information. Although no tribal members were consulted or invited to the negotiations, the Office of Indian Affairs (now the BIA) provided some input to the Commission on tribal needs. It suggested that present and future depletions from tribal use on Arizona’s Upper Basin lands would total about 25,000 acre-feet per year but cautioned that this estimate was preliminary (Official Record, 5th Meeting, pages 49-51).
When the dust settled, Carson accepted a fixed 50,000 acre-feet per year, only 37% of Arizona’s contribution to the flow of the river at Lee Ferry. The only other state that accepted an apportionment smaller than its contribution was Colorado. It produces 70% of the river’s flow at Lee Ferry but accepted a 51.75% apportionment (~72% of its contribution). In contrast, New Mexico which contributes only 1.6% of the river’s flow, got an apportionment of 11.25%. What made Arizona happy was the package deal that accompanied the agreement on the state apportionments. The three other Upper Division States accepted a proposal by Colorado and Arizona that apportionments be measured by the stream depletion theory. Under the stream depletion theory, the Upper Basin’s compact apportionment is measured as the net impact of man-made depletions on the natural flow of the Colorado River at Lee Ferry. The agreement on the stream depletion theory was made a part of Article VI of the Upper Basin Compact. Article VI is applicable to the Upper Basin only, but Upper Basin officials, including Stone and Tipton, would later testify before Congressional committees that it was their opinion that the Lower Basin’s 1922 Compact apportionment was supposed to be measured as the net impact of the Lower Basin’s man-made depletions on the natural flow of the Colorado River at the international boundary with Mexico.
Why was adoption of the stream depletion theory an important victory for Arizona? Simply put, under Arizona’s interpretation of the 1922 Compact at the time, using the stream depletion theory, Arizona’s could consume two million acre-feet per year on the Gila River system, but only be charged for one million acre-feet of compact apportionment. In its natural state, the Gila River loses an average of one million acre-feet per year as it flows from the Phoenix area to its confluence with the Colorado River at Yuma. Under the stream depletion theory, the net impact of consuming two million acre-feet per year of Gila system on the natural flow of the Colorado River was only a million acre-feet. If Arizona was going to be limited under the 1922 Compact to the use of about 3.8 million acre-feet (2.8 million under its Boulder Canyon Project Act allocation plus all one million acre-feet of III(b) water (less a small amount set aside for Utah and New Mexico), using the stream depletion theory freed up a million acre-feet that the CAP could pump from Lake Havasu to Central Arizona.
California, of course, had a different theory on how 1922 Compact apportionments were supposed to be measured. It advocated for the “diversions minus return flows” theory. Under this theory, all two million acre-feet of Arizona’s Gila River use would be charged to Arizona as compact apportionment. Under this method, the water available for the CAP would be a million acre-feet less, likely making the project economically unfeasible. For more details on the different theories and why Colorado believed the stream depletion theory benefited the Upper Basin, see Science Be Dammed chapter 12.
During the negotiations of the Upper Basin Compact, Wyoming had initially opposed using the stream depletion theory. Speaking for its delegation, Wehrli questioned the basic legal assumption that the 1922 Compact apportioned depletions, noting that California’s legal argument had merit. He concluded that stream depletion theory benefited the Lower Basin more than the Upper Basin and he stated, “Wyoming is desirous of staying completely out of the controversy between Arizona and California, Lower Basin States” (Official Record, 7th Meeting, pages 58-60). To reach a final compact agreement, Wyoming ultimately accepted the stream depletion theory, but unlike Colorado, it never championed it in Congressional testimony or court filings. Note, with perfect hindsight, Wehrli was mostly right, but also note that the question of how to measure apportionments under the 1922 Compact has never been resolved.
What Carson accomplished by accepting a small apportionment was to strengthen the close working relationship between his state and the four States of the Upper Division. It’s apparent that Carson believed that this relationship would help Arizona in its battle with California over the Congressional authorization of the CAP. In his compact report to the Governor, Carson writes that his engineers and the Indian Service believed that Arizona would never use more than about 30,000 acre-feet per year on its Upper Basin lands and therefore Arizona received 50,000 acre-feet as a measure of safety. He makes no mention of any input or consultation with the Navajo Nation, nor does he refer to the 49,200 acre-feet estimate made by the Bureau of Reclamation. Concerning Article VI and the stream depletion theory he writes, “[t]his of course is in complete accord with Arizona’s construction of the Colorado River Compact, and it is believed will be helpful to Arizona in opposing California’s arguments on the Gila River.” Carson concluded his report with “I believe it to be fair, just, and equitable to all of the States, and particularly valuable to Arizona in that it supports Arizona’s position in opposition to the arguments made by certain California interests” (Carson’s report is included in the record of the 1949 Congressional Hearings on the Upper Basin Compact, pages 128-139).
After a minor kerfuffle with California’s Congressional delegation which was settled by report language making it clear that by approving the Upper Basin Compact, Congress was not committing the United States to any interpretation of the 1922 Compact, it was approved by Congress and became effective on April 6, 1949.
Was the Carson strategy to minimize its claims for Upper Basin water and enlist the Upper Division States as close allies in Arizona’s quest to build the CAP successful? The short answer is yes, the result was that the CAP was authorized in 1968 and has been fully operational for about three decades. The path that Arizona used to get there, however, differed from the one that he envisioned. Carson who died in 1951, believed that Arizona would use the stream depletion theory to convince Congress, or if that failed, the Supreme Court, that Arizona had a sufficient legal water supply under the 1922 Compact to build and operate the CAP. Indeed, in 1952 when Arizona filed suit against California, one of its claims for relief was that it asked the Supreme Court to find that the stream depletion theory was the proper method of measuring apportionments under the 1922 Compact.
In one of the first major turning points in the case, in 1954 California filed a joinder motion to bring the Upper Basin States into the case arguing that the compact issues that Arizona wanted the court to interpret such as how apportionments are measured, how the surplus is measured for Mexican Treaty purposes, and how mainstem reservoir evaporation is handled were basin wide issues that impacted all seven states. From today’s perspective, California’s logic seems obvious, but that was not the case in the 1950s. In a coordinated response, Arizona and the Upper Divisions States convinced Special Master George Haight that the case involved Lower Basin matters only. While the Upper Division States had independent reasons to stay out of the case, they were concerned that their participation in the case would delay Congressional approval of the Colorado River Storage Project, clearly had they decided that they needed to be in the case, the Special Master would most likely have let them in. Note, New Mexico and Utah were parties to the case as to their Lower Basin interests only.
Ultimately, Haight’s successor, Simon Rifkind determined that the 1922 Compact did not need to be interpreted to decide the case. Thus, the disputed compact issues raised by Arizona in 1952 remain unresolved. In 1963 the Supreme Court agreed, ruling that the 1928 Boulder Canyon Project Act allocated 2.8 million acre-feet per year of mainstem water to Arizona, but subject to water availability under the 1922 Compact. This gave Arizona sufficient water to gain Congressional approval of the CAP. Had Arizona not followed Carson’s advice and chosen a more adversarial approach to dealing with the Upper Basin States, it is unclear if the CAP would exist today.
Arizona’s 50,000 acre-feet apportionment was also used to support the CAP because a portion of the power generated by the Navajo Generating Station was used to power the pumps used by the CAP to move water from Lake Havasu to central Arizona. At its peak the coal-fired plant consumed over 28,000 acre-feet per year. The plant was shut down in 2019. Today, the average use of Arizona’s Upper Basin apportionment is about 11,000 acre-feet per year (U.S. Bureau of Reclamation, Upper Colorado River Basin Consumptive Uses and Losses Spreadsheet, 20240624 version. Note the consumptive use numbers on this spreadsheet are not necessarily the same as Arizona’s use under Article VI of the Upper Basin Compact).
Now nearly eight decades after the water needs of the Native Americans living in Arizona’s Upper Basin lands were subordinated to its interests in the authorization and construction of the CAP, Arizona, the Navajo Nation, the Hopi Tribe, the San Juan Southern Paiutes, the United States and others have reached a water rights settlement. The settlement divides Arizona’s 50,000 acre-feet of Upper Basin water into three ways: 44,700 acre-feet per year for the Navajo Nation, 2,300 acre-feet per year for the Hopi Tribe, and 3,000 acre-feet per year for the City of Page. Note, the settlement goes beyond just allocating Arizona’s Upper Basin water, it also addresses the Lower Basin Colorado River, groundwater, and the Little Colorado River (a Lower Basin stream).
We thus have finally reached the point where the water Carson told Congress was intended for use by Native Americans might actually be theirs to use.
At the Santa Fe meeting, there was general support and enthusiasm for Congressional approval (and funding) of the settlement. Tom Buschatzke, Director of AWDR missed the meeting because he was in Washington advocating support of legislation authorizing the settlement. The Salt River Project, IID, and CAP all support the settlement.
The settlement of tribal rights has always raised difficult issues for both basins. The rights of Navajo, Hopi, and Southern San Juan Paiute people to use the Colorado River for both consumptive and cultural purposes predate statehood of all four Upper Division States. Their rights are “pre-compact” rights and thus, under Article VIII, are not impaired by the 1922 Compact. The use of water by tribal sovereigns has never fit well into the state-centric water use rules established by the Euro-American settlers. When the Navajo Nation, a sovereign entity, signed its1868 Treaty with the United States, it was one community. Today, it is crisscrossed with boundary lines. It has land and water in three Upper Division States, in both the Upper and Lower Colorado River Basins, and in the Rio Grande as well.
Whatever the detailed issues are, it is now time to get past them and move the Basin toward unanimous support for approval and implementation of this important settlement.