The “anticommons” revisited: that time Phoenix tried to leave more water in Lake Mead

Ry Rivard, a reporter for Voice of San Diego who is part of the Colorado River journalism posse, had the most tweetable summary of the dustup within Arizona and among the seven Colorado River basin states:


Four years ago, when I was young and naive, I pointed to what in retrospect I now realize was a warning sign of the train wreck we’re now seeing. Phoenix had rights to some extra Colorado River water it wasn’t using, and it wanted to leave it in Lake Mead. The Central Arizona Water Conservation District, the government agency that runs the Central Arizona Project, had the power to block this, and did.

It’s an example of what an academic colleague described to me at the time as “the anticommons” – where single users of a common pool resource have the power individually to block solutions that are in the collective best interest of the users as a whole.

Daniel Rothberg at the Nevada Independent did a great job in a piece yesterday of showing how politically and diplomatically isolated the Central Arizona Project’s managers have become right now, both within Arizona and in the basin-wide process of coming to terms with how to use less Colorado River water. It’s not just other states mad at Arizona. It’s other states mad at one water agency within Arizona – the CAWCD – and a bunch of other people within Arizona also mad at that the CAWCD.


Denver Water accuses Central Arizona Project of manipulating water orders to take more water from Lake Mead

Denver Water today joined state leaders in the Upper Colorado River Basin with a letter accusing the managers of the Central Arizona Project of manipulating water orders to get more water out of the Upper Basin’s reservoir at Lake Powell. The actions of the CAP’s managers “several compromise the trust and cooperation” needed to solve Colorado River problems, the letter from Denver Water’s Jim Lochhead said. Full text:


Background here.

On the U.S. part of the Rio Grande, the San Luis Valley is where most farming takes place

In water management, it’s normal to zero in on one’s local geography and not think about the larger system – especially when state lines carve up a watershed. Thus, faced with a terrible snowpack year on the Rio Grande, we’re having three largely separate conversations about agricultural water management on the U.S. part of the Rio Grande:

  • The San Luis Valley (the headwaters valley in Colorado)
  • The “Middle Rio Grande” (that stretch through Albuquerque where I live)
  • The “Lower Rio Grande” – New Mexico south of Elephant Butte Reservoir, plus El Paso County in Texas

Here is some interesting data by way of comparison about how people are using the water in those three sub-watersheds. It’s total crop revenue, which is a good measure of how much farming is happening in each place. Water people are often surprised to learn that the San Luis Valley is, by this measure, the most productive part of the system. These are 2016 (the most recent year available) total crop revenue numbers from the Department of Commerce.

  • Middle Rio Grande: $16.1 million
  • Lower Rio Grande: $376 million
  • San Luis Valley: $412 million


Colorado River Upper Basin states accuse Central Arizona Project managers of threatening the health of the Colorado River system

Upper Colorado River Basin state leaders, in a letter Friday (April 13, 2018), said the water management approach being taken by the managers of the Central Arizona Project “threaten the water supply for nearly 40 million people in the United States and Mexico, and threaten the interstate relationships and good will that must be maintained if we are to find and implement collaborative solutions” to the Colorado River’s problems.

The letter accuses CAP of “disregard(ing) the basin’s dire situation”, providing more water for Arizona at the expense of the rest of the basin. In doing so, it highlights a rift within Arizona, where an internal political feud over this and related issues has pitted CAP against the state Department of Water Resources and many of CAP’s own customers. That rift, in turn, has stalled diplomacy over efforts to develop a broad new plan to cut back water use across the Colorado River basin.

The letter, using language that is striking in the normally staid interstate diplomacy of Colorado River interstate water management, takes issue with CAP’s practice of using more water than it might otherwise – avoiding “overconserving”, in CAP’s words – in order to ensure continue big releases from Lake Powell upstream. That has the effect of expanding water use in the Lower Colorado River Basin at the expense of draining Lake Powell, the critical reservoir for protecting Upper Colorado River Basin supplies. The managers of the Central Arizona Project are “disregard(ing) the (Colorado River) basin’s dire situation at the expense of Lake Powell and all the other basin states” by using more water than they need to, the letter said.


On Twitter last week, in response to something I wrote here, Central Arizona Project General Manager Ted Cooke defended CAP’s practice, calling it wise placement of water orders under the 2007 rules governing reservoir storage on the Colorado River. Those rules attempt to even out storage between Lake Mead – which supplies the Lower Basin states of Arizona, Nevada, and California, plus Mexico – and Lake Powell, which maintains a storage bank for the Upper Basin states of Wyoming, Colorado, New Mexico (I raise my hand to declare an Upper Basin bias here) and Utah. The rules have created an incentive for the Central Arizona Project, which manages a big fraction of Arizona’s supply of Colorado River to avoid “overconserving” – again, this is CAP’s word – at a time when everyone in the Colorado River Basin is trying to use less water. The Upper Basin states (the letter was signed by the top water officials from all four) say that “attempts to maximize demands to increase releases from Lake Powell could ultimately accelerate lower reservoir conditions in both the Upper and Lower Basins and cause shortages in Lake Mead.”

The issue of the Central Arizona Project’s approach to this issue has been simmering for more than a year. Water managers have long known the rules created this incentive for the CAP’s managers, but the agency’s increasingly brazen public discussions of it have become problematic. The public version of the debate goes back to a March 2, 2017 meeting of the board of the Central Arizona Water Conservation District, the agency that runs the CAP. Tony Davis at the Arizona Daily Star nicely documented the debate in this story, quoting CAP water policy director Suzanne Ticknor explaining to her board the risk to Arizona of “overconserving”.

That word echoed through the Colorado River water community at a time when other states were struggling with how to conserve more water, not worrying that they might be conserving too much.

It also highlighted an increasingly divisive breakdown within Arizona on this issue. Kathryn Sorensen, director of Phoenix’s water department, was quoted in Tony’s story criticizing CAP’s approach. “The ‘risk’ of overconserving is a Colorado River that is less vulnerable to shortages and more resilient over the long run, a river that is more protective of our economy and our quality of life,” she told Davis. Others in Arizona have become increasingly critical of CAWCD/CAP approach. “CAWCD does not speak for Arizona,” Carol Ward-Morris of the Arizona Municipal Water Users Associated tweeted this week in response to my blog post about the allegation that CAP is “gaming” Colorado River water management rules.

The full letter, which has spreading quickly through Colorado River management circles this weekend, is here:


One of the worst years in a century of records on New Mexico’s Rio Grande?

Experimenting with some data visualizations to try to help make sense of where this very dry year on the West’s rivers fits into historical context, I came up this morning with this:

The spaghetti is daily flow for each year in the USGS historic record for the gauge at Embudo in northern New Mexico – the oldest gauge in the country, with a nearly continuous record back to 1895. The red line is this year.

I’m not sure this visualization works for a general public audience, but for me it did the trick.

As you can see, at this point in the year, the river should be rising as snowpack melts. It’s dropping. And a quick glance at the graph showed that this year is, in fact, historic – the second driest at this point in April on record.

Code here.

Is the Central Arizona Project gaming reservoir levels to take more water from the Upper Basin?

This Central Arizona Project infographic has been a bit of a “WTF” moment in the Colorado River Basin management community:

Central Arizona Project infographic

Kudos to whoever designed this. I’ve struggled to find ways to explain this. First posted to the Internet, then apparently taken down, it’s a solid explanation of the tricky way the Central Arizona Project has been managing its use of Lake Mead water – call for and use enough water early in the year to drop Lake Mead far enough to trigger a big release from Lake Powell, then crank back the orders later in the year to put the brakes on and keep Lake Mead from dropping so far that it’ll slip below elevation 1,075 and trigger a shortage declaration.

That this would happen should be no surprise. It would be weird for Arizona to not try to use the rules, negotiated by all, to best advantage. What’s awkward right now is the brazenly public way CAP has been talking about this, managing Mead’s “sweet spot” by not over-conserving water. You can see displeasure with this even in Arizona in today’s blog post by Warren Tenney of the Arizona Municipal Water Users Association.

In fact, folks in the Upper Basin have long been aware of the risk and reality that Lower Basin water users, especially CAP, might manage their reservoir this way. The problem with CAP being so blatant about it is the optics. This heightens basin-to-basin tensions that don’t need to be heightened right now. Folks in the Upper Basin are working hard to come up with water management tools to reduce water use, and/or to fight off efforts to increase water use. In doing so, we run into a consistent argument: “Why should I cut back my use, or my aspirations, to prop up levels in Lake Powell just to benefit the Lower Basin?” The answer to that has to be that each basin benefits when the other cuts its use. But CAP’s very public “we don’t want to overconserve, lest we lose access to the big 9 million acre foot releases from Lake Powell” makes it a lot harder to persuade Upper Basin users to cut back as part of a “we’re all in this together” argument.

I don’t understand the politics here. CAP’s very public “sweet spot” discussion suggests CAP’s desire to win a political fight within Arizona outweighs any broader interest of Arizona as a state in being a cooperative participant in basin-wide diplomacy. Or maybe I do understand the politics. In my book, I opened the chapter about Arizona thus:

In the struggle to share the Colorado River, Arizona has always been its own worst enemy.

New Mexico Water: What Our Next Leaders Need to Know

My University of New Mexico water colleagues and I are hosting a conference May 17:

New Mexico Water:
What Our Next Leaders Need to Know

Following the 2018 gubernatorial election, New Mexico will have new leaders of its resource management
agencies. This conference will consider NM water & environmental challenges with presentations by former
senior state and federal officials. Speakers include former NM State Engineers, Secretaries of the NMED, and
former top level federal officials. All have lengthy experience NM.

Registration:
Registration before April 27: General – $30, Full time students – $10
Registration after April 27: General – $50, Full time students – $20

Register at http://cwe.unm.edu/outreach-and-education/2018-water-conference.html

Why, in 1928, the Bureau of Reclamation treated Mexico as part of the Colorado River Basin

A guest post by historian Sara A. Porterfield, Ph.D. Candidate, University of Colorado at Boulder
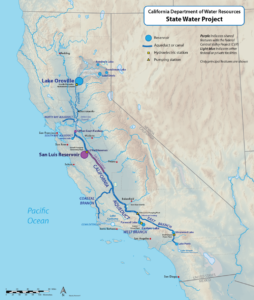
Modern USBR map

As I was working on a draft of my dissertation’s introduction a couple months ago, I decided that I HAD to know what percentage of the Colorado River Basin lies in Mexico. This factoid would have taken up half of a sentence and wasn’t necessary to my argument or larger purpose, but I was probably subconsciously (ok, consciously) looking for a way to procrastinate tackling the larger issues of the introduction, like formulating my argument. I put this question out to the #CORiver Twitterverse, and John, Abby Burk (of the Audubon Society), and I started an email chain that went way, way down a Colorado River rabbit hole.

Somewhere in that email chain John sent along a 1928 map of the Colorado Basin that included Mexico, writing that he was “fascinated by what they were thinking about in 1928 that made them include it. It certainly was not a time during which we were cheerfully thinking about sharing water with Mexico.” I looked at the map and thought what was Mexico doing on that map? This sounded like a job for a historian!
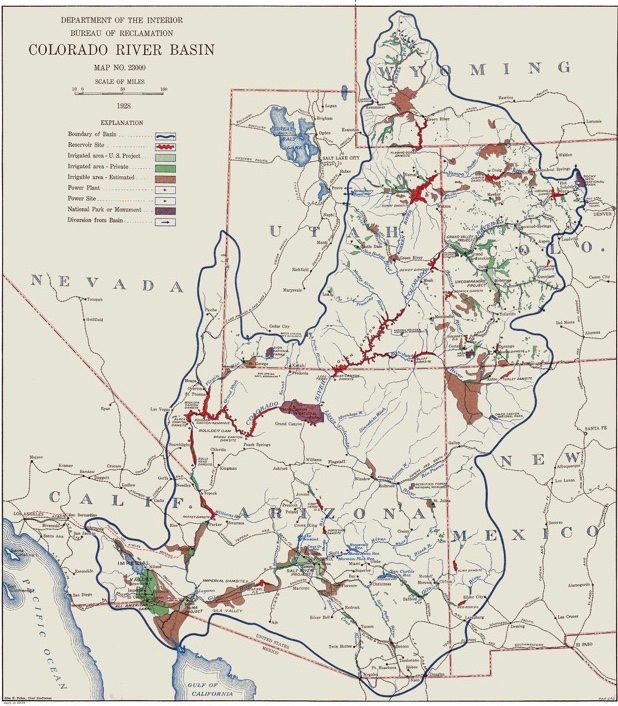
1928 USBR map

I spent a little time looking at both the newer U.S. Bureau of Reclamation map that includes Mexico and the 1928 map John had sent me. Here’s my theory about why the Bureau would have included Mexico in their 1928 map.

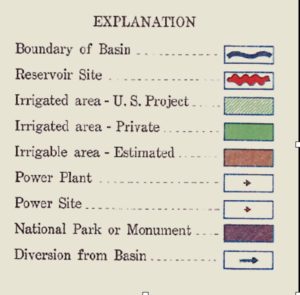
The key to the 1928 map is what really got me thinking. There’s reservoir sites, national parks/monuments, and power projects listed, sure, but the only thing in the key that appears in the Mexican part of the Basin is the dark green of the private irrigated areas and the dark brown of the estimated irrigable areas.

This made me think that those making (or directing the making of) the 1928 map were far more concerned with irrigation potential than with geographic/hydrologic accuracy, as the modern map seems to take as its aim. The irrigation and potential irrigation marked on the 1928 map led me to that conclusion, as well as the fact that they extended the Basin to include the Salton Sink/Imperial Valley—which it doesn’t today.

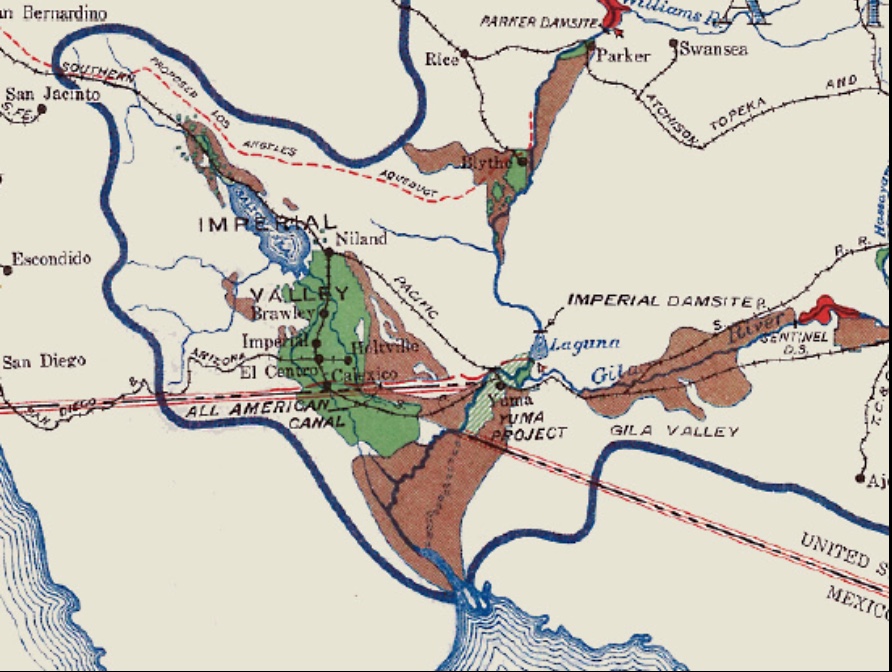
Lower Colorado, from 1928 USBR map

So, after looking through my research database and not finding anything, I remembered the Fall-Davis Report, officially titled Problems of Imperial Valley and Vicinity and published in 1922.

Bingo.

The Basin map included in the Fall-Davis Report is almost identical in outline to the 1928 map from John. The Fall-Davis map is quite a bit simpler than the 1928 map and doesn’t seem to have the key/shading the 1928 map does—just a Basin outline with existing and potential irrigation and hydropower projects.

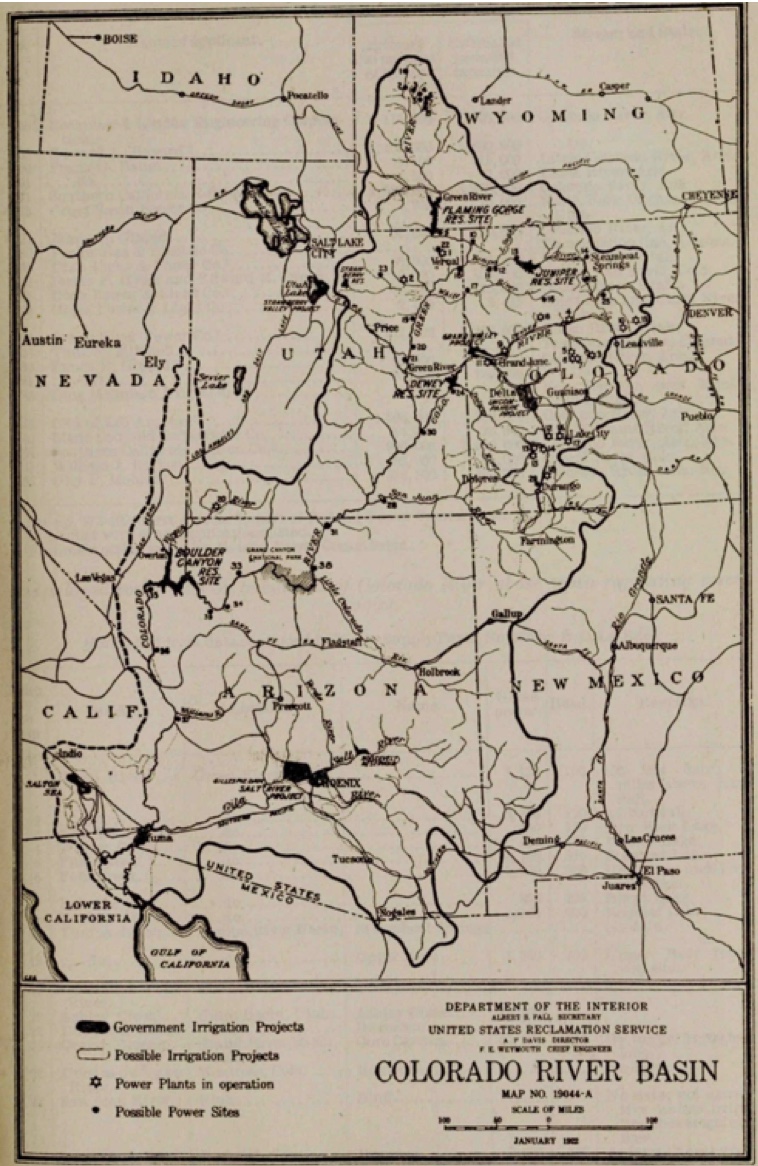
Fall-Davis Report map

The Fall-Davis Report advocated for the construction of two projects: Hoover Dam and an “All-American” Canal, and I think these two projects help us understand why the 1928 map and the Fall-Davis map were drawn the way they were. First, Imperial Valley irrigators and BuRec engineers wanted Hoover Dam (then called Boulder Dam) for flood control to protect irrigation in the delta region. The floods of 1905-1907 that tore out an Imperial Valley headgate and created the Salton Sea were a not too distant memory for Imperial Valley residents and Bureau engineers—and Davis and others in BuRec wanted to do everything in their power to prevent that from happening again. From this, I can see why they would have drawn the Basin to include the Salton Sink since the river could, conceivably, change course and flood the Imperial Valley again at any moment, thus destroying the booming agricultural industry there. Drawing the Salton Sink into the map made clear the threat of the river doing this again.

Second—and more to the point—I believe these maps include Mexico because the U.S. was worried about Mexico taking water out of the Alamo Canal on its way to the Imperial Valley. The geography of the eastern side of the Imperial Valley along the western bank of the Colorado was such that it was difficult to construct a canal due to a sea of sand dunes with a tendency to drift, so the original Imperial irrigators negotiated with Mexico to bring water to the Imperial Valley via the Alamo Cana. The Alamo took water out of the Colorado in Mexico, diverted it south of those pesky sand dunes, and then delivered the water to Imperial irrigators across the California line. Those irrigators worried that Mexican irrigators would try and steal “their” water on its way to their crops—and therefore advocated for an “All-American” Canal that would eliminate the need to bring water through Mexico (For more on this, see “Chapter 2: Imperial Joins the Crusade” in Norris Hundley’s Water and the West).

So.

The 1928 map as well as the Fall-Davis map (to a lesser extent) included Mexico and its irrigated and potentially irrigated acreage in order to make the argument for the All-American Canal. Those making the maps—including BuRec bureaucrats and engineers and Imperial irrigators—wanted to scare legislators into thinking that Mexico could develop tens of thousands of acres of land with water “stolen” from the Alamo Canal. The Fall-Davis Report says as much: “The Imperial irrigation district contains more than 100,000 acres of irrigable land not yet irrigated and the same valley in Mexico can increase over 40,000 acres, and is in a physical position to take the necessary water from the Imperial [Alamo] Canal before it reaches the California line” (p. 6).

The BuRec didn’t include Mexico in its 1928 map out of the goodness of their heart or out of an allegiance to hydrologic accuracy, but because they wanted to shut down agriculture in the Mexican delta. What can seem like a cartographic anomaly—the inclusion of a portion of the Basin not seen until the twenty-first century popping up in an early-twentieth-century map—reveals the map makers’ motives, how the U.S. valued water, and the status of the nation’s diplomatic relationship with Mexico in that moment. These hidden histories uncover the Colorado’s past and help us understand more clearly the current dynamics at play in the Colorado Basin today.

– Sara Porterfield

The Cape Town lesson: avoiding apocalypse

The headline on this terrific Robyn Dixon piece in the LA Times about how Cape Town staved of a water supply catastrophe has created an unfortunate framing:

How Cape Town found water savings California never dreamed of

One frequent interpretation as it rocketed around water-interested social media was, “We’re pathetic, look how much better Cape Town did compared to us!”

But that’s not the right takeaway, I think. There’s a really important message embedded in this:

High-income Cape Town families have cut their average water use by 80%, according to Martine Visser, director of the Environmental Policy Research Unit at the University of Cape Town, while low-income families cut back by 40%. After city residents were restricted to just over 13 gallons per person a day, any household that blew the limit had a water restriction device attached to its pipes by authorities.

The extraordinary savings — in the heat of the Southern Hemisphere summer — put to shame how much water California used daily when its drought dragged into the summer of 2016: 109 gallons per person.

During the devastating 1996-2010 “Millennium Drought” in Brisbane, Australia, daily water use tumbled from 79 gallons per person to just 44 gallons. Impressive, but not as good as Cape Town.

In each case, the cutback is commensurate with the needed response to specific local conditions. In cutting back to 109 gpcd, Californians cut back to the levels needed to respond to their local water supply situations. Things were worse in Brisbane, so residents had to cut back farther. Things were really bad in Cape Town, so they had to cut back a lot.

The message is that, if the need is there, in these modern rich world settings we are able to dial back our water use a lot. The apocalypse is not nigh.

When people have less water, they use less water.


The Colorado River-Sacramento Delta Connection

With an 85 percent allocation of northern California water from California’s State Water Project last year, the Metropolitan Water District of Southern California was able to cut back on its use of Colorado River water, leaving more than 300,000 acre feet in Lake Mead. That water has provided a sufficient buffer than Mead will end this year at an elevation of 1,077 feet above sea level, barely above the threshold (1,075) at which a Lower Colorado River Basin shortage is declared, with enforced water use cutbacks in the Lower Basin.

California State Water Project, courtesy Wikimedia Commons

This year, with a current California State Water Project allocation of 20 percent, Met has far less wiggle room, less flexibility to leave water in Mead. In other words, problems in Northern California, in the supplies that flow through the Sacramento Delta to the State Water Project pumps, create risks for the Colorado River because of the interlocking nature of the two systems.

Met has a history in recent decades as a collaborative, positive participant in Colorado River governance. All else equal, Met has repeatedly shown a willingness to do the right thing for the Colorado River Basin as a whole. But it must first act to ensure the reliability of its own system supply.

This was the animating point of the talk I gave last week at the California Water Policy Conference at U.C. Davis. California is the 800 pound gorilla in the western water room. How it deals with the problem of moving water through the Sacramento Delta has a huge impact on the entire west. Success in ensuring reliability of delta supply to southern California decreases pressure on the Colorado River. Failure increases that pressure. Which is an overlong setup to my interest in this process, as Met considers picking up the full price tag for building two big tunnels beneath the delta. Via Ryan Sabalow:

Pushing ahead with an ambitious effort to take a majority stake in the state’s troubled $16.7 billion tunnels project, Southern California’s behemoth water agency announced Tuesday that the plan would cost its ratepayers less than $5 a month.

On Tuesday, staff at the Metropolitan Water District of Southern California told board members $4.80 was the most the 6.2 million households in Metropolitan’s service area could expect to pay if the agency moves ahead with plans to take on 65 percent of the share of building both tunnels.

One of the central points in the work of Elinor Ostrom, whose work animates a lot of my teaching in the UNM Water Resources Program, is the importance of the boundaries we draw around a resource problem. We tend to do it at the local or state level, awkwardly sometimes at the scale of river basins spanning two or more states, and only very awkwardly in a case like these were the resource system that matters spans two entirely different systems, connected via these giant canals that we built in the 20th century.

So I sit out here, two states away from Los Angeles, three states away from Sacramento, and watch California and fret.