How Lake Mead could crash

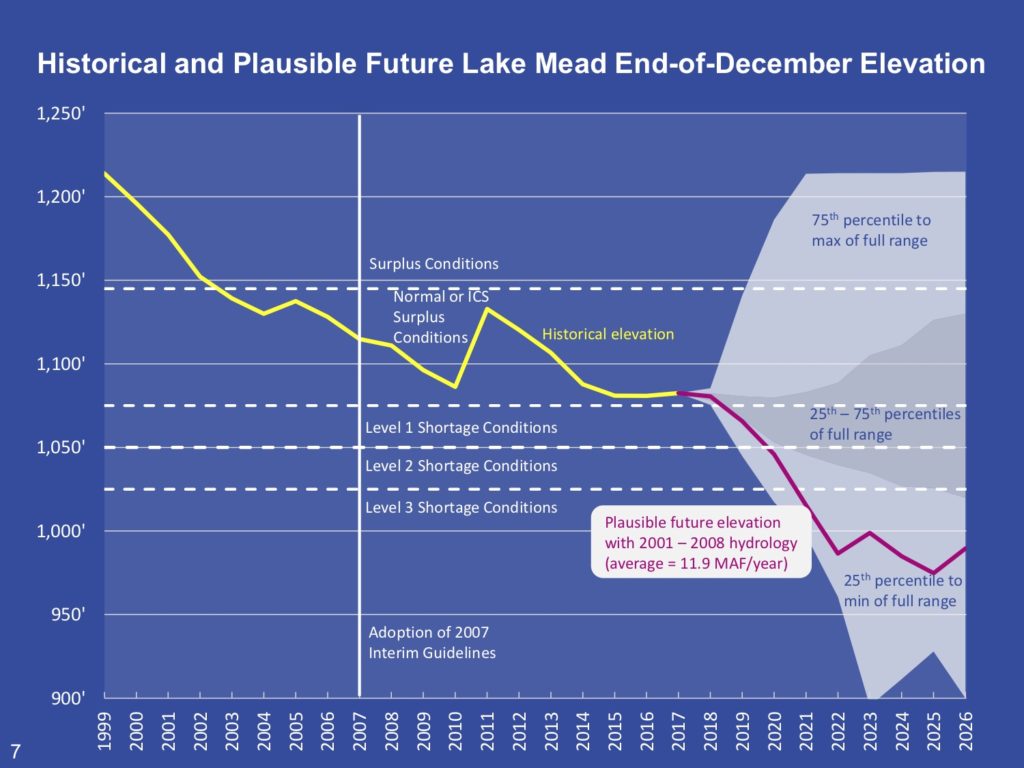
Speaking last week before the Imperial Irrigation District board, Reclamation Commissioner Brenda Burman showed this remarkable slide. It is remarkable for obvious reasons – it shows how easily we could crash Lake Mead! But it’s remarkable in a more subtle way that reflects a shift in our approach to the hydrologic analysis of the Colorado River’s flow, and how we think about risks, probabilities, and the worst case:

Crashing Lake Mead

Here’s how the Desert Sun’s Ian James, who was at the meeting, explained the first point:

Stressing the urgency of her appeal, Burman showed a chart with a range of possible reservoir levels for Lake Mead in the mid-2020s, including a worst-case scenario in which the reservoir falls to “dead pool” — too low for any water to flow over Hoover Dam. (emphasis added)

The second point is more subtle, involving the decisions embedded in the traditional representations of Lake Mead risk scenarios, and the choice Burman and the Bureau’s staff made in drawing that purply line to illustrate how bad things could get, how quickly.

For the book we’re writing, Eric Kuhn and I have been taking a deep dive into the history of water managers’ measurements of the Colorado River’s flow, and the use of those measurements in decision-making going back a century. One of the critical parameters chosen by decision makers is the “period of record” – what period of river flows do you use as the basis for your decisions?

The gray and light blue clouds shown in Burman’s diagram are a great example of how this works. Those represent the statistics of risk. The grayish bit in the middle, for example, represents a 25 percent risk of Lake Mead dropping below elevation 1,050 in 2020. (That would be really bad!) But what is the universe of possible futures on which that risk is calculated?

The answer (found by clicking on the “download table” link at the bottom of this page) is that the calculation is based on the statistics of Colorado River flow over the period 1906 to 2015. The Bureau this spring did a bunch of hairy calculations involving 3,850 different “futures”, all based on the foundational assumption that the statistics of the future will look something like the statistics of the past. Of course we know that’s not true in a general sense, because climate change mucks up such calculations (see Milly et. al, Stationarity Is Dead: Whither Water Management?). But even independent of climate change, we’ve known for a while that using 1906 to the present as a foundation for Colorado River water management decisions is problematic because of the anomalously wet first 25 years of that record.

To overcome that problem, water managers have been using a “stress test” hydrology, skipping forward to base this type of analysis on a shorter, more recent period of record that ignores some of the older anomalously wet, pre-climate change flows and begins to focus on the era of climate change (shoutout to my book collaborator Eric Kuhn and some other river thinkers in the Upper Basin for pioneering this clever hack).

The purply line on Burman’s slide demonstrates the use of a sort of “super stress test” hydrology as a communication tool, allowing us to focus our attention on a period of time untainted by the anomalously wet years of the early 20th century and fully tainted by the brutal impacts of climate change. It does so without having to invoke the freighted language of future climate change projections, pointing by way of analogy to a period of time in the experience of the people faced with making decisions today. This could happen because the hydrology we’re illustrating has happened in the recent past.

There’s a lot more going on this graph, especially the problems faced by Lake Powell in the purply line scenario. Burman’s purple line only crashes that badly and that fast because Lake Powell is also crashing at the same time. I’d like to come back to that tomorrow, because there’s some interesting new work by folks in the Upper Basin that can help us better visualize that as well.

Record low flows on the Gila

Record low flows on the Gila River in New Mexico

Another of my attempts to visualize data from this remarkably bad water year in New Mexico. The cloud of gray lines is flow at the Gila gauge as the river leaves its headwaters mountains in southwestern New Mexico, one line for each year. The red line is this year – significantly lower than in any of the 89 years of record.

(Code here, modified to plot a log scale on the y axis to make it easier to visualize the low flows.)

Old water – the San Luis People’s Ditch

San Luis People’s Ditch, May 2018

I took the long way home from a meeting in Alamos, Colorado, yesterday to make a pilgrimage to San Luis.

In the Culebra Valley of Colorado in the high country near the New Mexico border, San Luis lays claim to being the oldest town in Colorado, settled by the descendants of Spanish immigrant families. Native erasure notwithstanding, it’s an important claim and an important place. The San Luis People’s Ditch (above) stakes its water rights claim toApril, 1852, the oldest continuously irrigated water rights claim in the state of Colorado. 21 cubic feet per second, 1,600 acres, still running yesterday despite a vicious drought.

What’s left of the Rio Grande

Rio Grande at Interstate 40, Albuquerque, May 21, 2018

I stopped on the Gail Ryba Bridge over the Rio Grande this morning, the bike bridge adjacent to Interstate 40 that offers one of the great views of our river. The morning light was lovely, I saw a couple of egrets in the ditch down below. I love this place.

Flows right now are stable at a bit more than 500 cfs at the gauge just downstream from here. At this point essentially all that water is human water ops. With a terrible snowpack this winter and farm water use to our north in Colorado, the river’s natural flow probably wouldn’t be enough to reach this spot were it not for agricultural water releases by the Middle Rio Grande Conservancy District from El Vado Reservoir, up on the Rio Chama.

This can’t last all summer, and absent a great summer rainy season and/or some creative juggling by the water agencies to stretch out their supplies, this could very well be a view of a dry riverbed by mid-July.


Federal pressure to do a Colorado River water conservation deal

Reclamation Commissioner Brenda Burman

Catching up after a busy final week of the semester at the University of New Mexico’s Water Resources Program, I had time today to sit down and and think through the implications of this remarkable Bureau of Reclamation press release.

It did a great job of achieving one of the primary goals of a news release, capturing a news cycle with the message of increasing risk of a “shortage” declaration by 2020, which would impose water delivery cutbacks on Nevada, Arizona, and Mexico. (“Mexico, 2 U.S. states could see Colorado River cutback in 2020” was a common takeaway.)

But that news peg – a slight increase in the latest Bureau analysis of a risk we already knew was there – wasn’t really news. We’ve known that since January, and the latest numbers represent only a minor tweak in the direction of increased risk. The real action was in Reclamation Commissioner Brenda Burman’s use of the “press release” platform to issue a very public call for action.

“We need action and we need it now. We can’t afford to wait for a crisis before we implement drought contingency plans,” said Reclamation Commissioner Burman. “We all—states, tribes, water districts, non-governmental organizations—have an obligation and responsibility to work together to meet the needs of over 40 million people who depend on reliable water and power from the Colorado River. I’m calling on the Colorado River basin states to put real – and effective – drought contingency plans in place before the end of this year.”

Henry Brean did a nice job of capturing the key point:

The head the federal agency that oversees the Colorado River has a message for state water managers: The outlook is bleak, so quit squabbling and get back to work.

In a pointed message Wednesday, U.S. Bureau of Reclamation Commissioner Brenda Burman said drought and low flows continue on the Colorado with no end in sight, so it’s up to those who rely on the river to stave off a coming crisis.

This was not a traditional press release. It was more akin to what in linguistic philosophy they call “performative utterances”, where the act of saying a word also carries out the action the word describes. “I apologize” is the most memorable example. The news release is kinda like this. It doesn’t describe Burman’s call to action. It is Burman’s call to action.

And then Burman and her staff did something particularly clever. They got statements of support for early action on a Colorado River Drought Contingency Plan from representatives of each of the seven U.S. Colorado River states. One of the rituals for a reporter in a situation like this is to try to get everyone on the record. Whaddya think, is Burman right, do we need a Drought Contingency Plan right away? Burman and her staff did it for us!

My favorite is John Entsminger from Nevada: “This ongoing drought is a serious situation and Mother Nature does not care about our politics or our schedules. We have a duty to get back to the table and finish the Drought Contingency Plan to protect the people and the environment that rely upon the Colorado River.”

A year-and-a-half ago I wrote that a deal to reduce Colorado River water allocations was “inevitable”. The recent fracas in Arizona over details of such a plan had left me questioning that notion. It’ll be interesting to see how successful this effort by Reclamation is to clearing the logjam and getting a Drought Contingency Plan done.

A drying Rio Grande

I went out to the Rio Grande yesterday morning to talk to KOB’s Eddie Garcia about the prospect of a drying Rio Grande through Albuquerque this summer.

The final forecast numbers put this year’s runoff at just 18 percent of the long term average. The flow right now at Embudo, as the Rio Grande is entering New Mexico’s populous middle valleys, is the second lowest it’s ever been at this time of year. Records there go back to 1889 – the oldest USGS gauge in the nation.

It’s not clear yet whether we’ll have complete drying through the Albuquerque reach, but it’s a possibility. The last time that happened – a zero cfs reading at the Central Avenue gauge – was 1977. The last time we’ve been under 30 cfs – which is still a trickle, but for all practical purposes is dry – was 1983.

Days with zero flow, USGS Albuquerque gauge

Historic low flows on New Mexico’s Gila River

Our UNM Water Resources Program students used the Gila River in New Mexico for their spring case study projects, so I’ve made it a habit to watch the USGS “Gila near Gila” gauge. Class is finished, but the habit is not.

Flow there dropped below 30 cubic feet per second this evening.

Update: I didn’t do the analysis right. It’s the lowest on record for this point in the year, not the lowest in general.

If I’ve done the analysis right, this is the lowest recorded flow on the Gila – not just for May 9, but the lowest period.

Record low on the Gila

Records go back to 1927.

Water use is going down

There’s a rock I keep pushing up a hill. But powerful forces are at work, and the rock keeps slipping my grasp and rolling back down. So I chase it down, and start anew.

I’ve given more than 30 public talks around the western United States since my book came out nearly two years ago, and every time I talk I include a bunch of graphs and data making the same point – water use is going down. Across nearly every geography, water source (surface and ground) or class of users. Water use is going down. And nearly every time, I get a combination of skeptical questions and eager followup from members of the audience on this point, whether the audience is water managers, or academics, or members of a more general public.


Here is no less a luminary than the official Twitter feed of the U.S. Bureau of Reclamation, arguably the most important federal water agency in the western United States:

BRB, I’m headed back down to catch the rock, in the meantime, via Peter Gleick and Brad Plumer, here’s a graph: