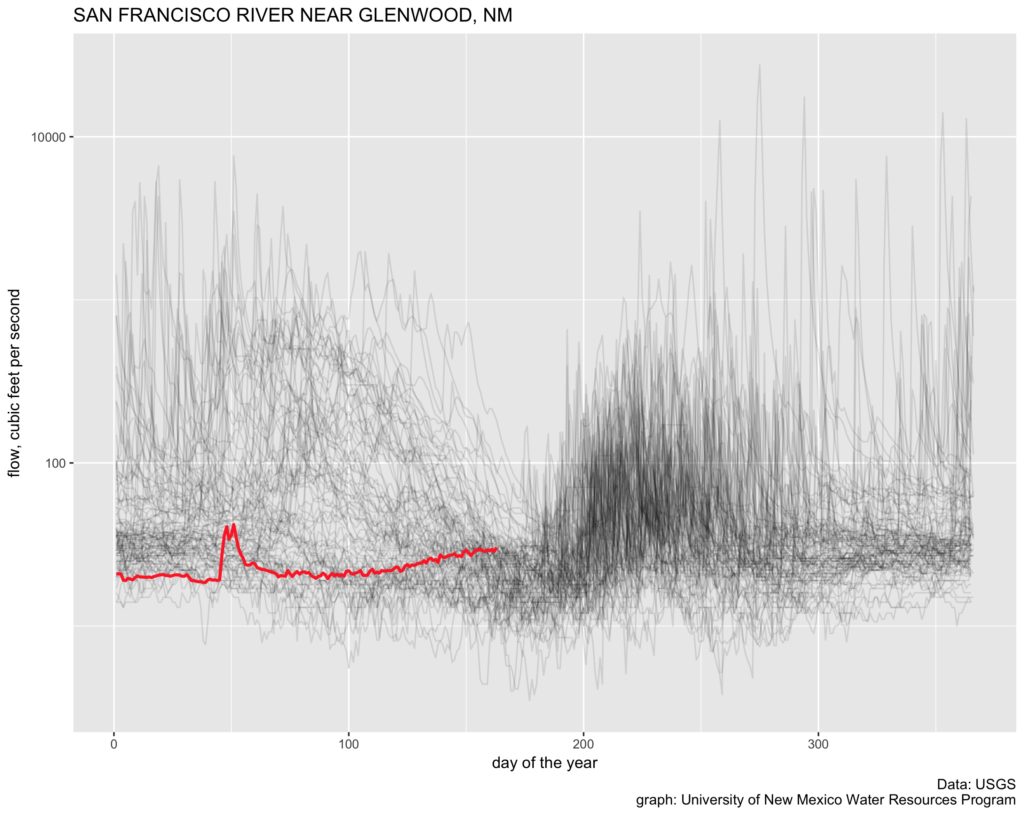
San Francisco river near Glenwood, NM
I’ve no idea what’s going on here, but a reader asked, so here’s a graph of the San Francisco River near Glenwood, New Mexico.

San Francisco river near Glenwood, NM
I’ve no idea what’s going on here, but a reader asked, so here’s a graph of the San Francisco River near Glenwood, New Mexico.
From New York Times reporter Philip Shabecoff’s October 1983 piece examining some of the more significant findings in a new National Academies report on the implications of climate change:
Paul E. Waggoner, a member of the assessment committee, said in an interview that ”people in California will be drinking their water,” instead of using it for irrigated farming.
The report was entitled “Changing climate : report of the Carbon Dioxide Assessment Committee / Board on Atmospheric Sciences and Climate, Commission on Physical Sciences, Mathematics, and Resources, National Research Council.” Here’s the chapter by Waggoner and Roger Revelle on the implications of climate change for the Colorado River and western water.
Reservoir levels dropped over the weekend past a critical trigger point, causing the Middle Rio Grande Conservancy District to curtail water deliveries this week to about 5,000 acres of farmland in central New Mexico.
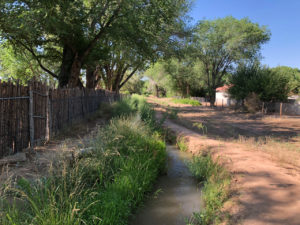
Middle Rio Grande Conservancy District water in Albuquerque’s North Valley, June 2018
With El Vado Reservoir on the Rio Chama just 26 percent full, the decision to cut deliveries to the MRGCD’s “water bank” irrigators was inevitable. These are farmers who had sold off their senior water rights, mostly to cities, but are stilled allowed to irrigate for a higher fee and subject to the availability of a pool of “surplus” water.
That “surplus” (I put scare quotes around this because there’s a serious policy argument about whether such a surplus really exists, and whether the “water bank” is a good idea) doesn’t exist in this very dry year.
The acreage here – 5,000 acres – is interesting. Water bank acreage had been running at about 2,000 acres per year in recent years. The jump is likely not an actual increase in irrigated acres, but rather appears to be people who had already sold off their priority rights (pre-1907 rights, the senior rights in the valley) and were just irrigating anyway. The District has been cracking down on that, so many of those people are now paying up and joining the water bank. Which means that, in a dry year, there is now a mechanism to cut them off.
Ben Cook, Justin Mankis, and Kevin Anchukaitis have an extremely helpful review paper in Current Climate Change Reports (ungated, thanks) sorting out what we do and don’t know about the impact of climate change on droughts.
The IPCC’s Fifth Assessment Report was cautious in its assessment of our knowledge of drought, reporting only “low confidence” in then-current assessments of the detection and attribution of a climate change impact on drought:
In the years since the AR5 was published, however, there have been steady advancements in our understanding of drought dynamics and the associated physical processes. These insights have been generated through further development of the paleoclimate record, new analyses of recent and historical drought events, and the widespread use and interrogation of climate models.
Focusing on Colorado River streamflow, Woodhouse et al. [109] compared this most recent drought period (2000–2012) against similar magnitude droughts in the 1950s (1950–1956) and 1960s (1959–1969). They found that while both the 1950s and 1960s droughts were linked to significant precipitation deficits, precipitation in the basin was near normal in the 2000s and this latest drought was likely driven by the much warmer temperatures. Udall et al. [110] subsequently concluded that historical warming of 0.9?C has reduced Colorado River flow by 2.7–9%, which would account for roughly one third of flow losses during the 2000–2014 drought in the basin. McCabe et al. [111] found similar effects of warming on streamflow in the Upper Colorado River Basin, attributing reductions in streamflow of 7% over the last three decades to increased evapotranspiration and snowmelt from warming in the spring and summer (April–September).
Our knowledge of climate change and drought has advanced considerably since the publication of the AR5. This expanded body of knowledge includes numerous studiesthat more confidently attribute recent droughts to climate change and paleoclimate analyses that highlight the unusual severity of recent droughts in the long-term context of the Common Era. These findings represent a marked shift from the much more conservative statements regarding drought and climate change in the AR5, which were appropriate for the time given the state of the science.
According to the USGS, there are 1,300 acres of golf course in Bernalillo County (Albuquerque etc.), using 6,100 acre feet per year of water. Which makes the water policy implications of this this Nolan Gray story fascinating:
Golf is dying, many experts say. According to one study by the golf industry group Pellucid Corp., the number of regular golfers fell from 30 to 20.9 million between 2002 and 2016. Ratings are down, equipment sales are lagging, and the number of rounds played annually has fallen….
Golf courses and country clubs currently consume massive amounts of relatively underutilized land in cities and suburbs. Across the country, as courses and clubs begin shutting down, hundreds of thousands of acres of land could soon start opening up for infill redevelopment. While not so great for golfers, this could be a boon for cities, especially those facing a housing crunch.
If my math is correct, flow on the Gila River gauge located near Gila, New Mexico, dropped today to the lowest ever measured, in a record that goes back 89 years.
The red line is the daily flow, in cubic feet per second, as measured by the U.S. Geological Survey. The cloud of gray lines is each previous year, in a record that goes back 89 years.
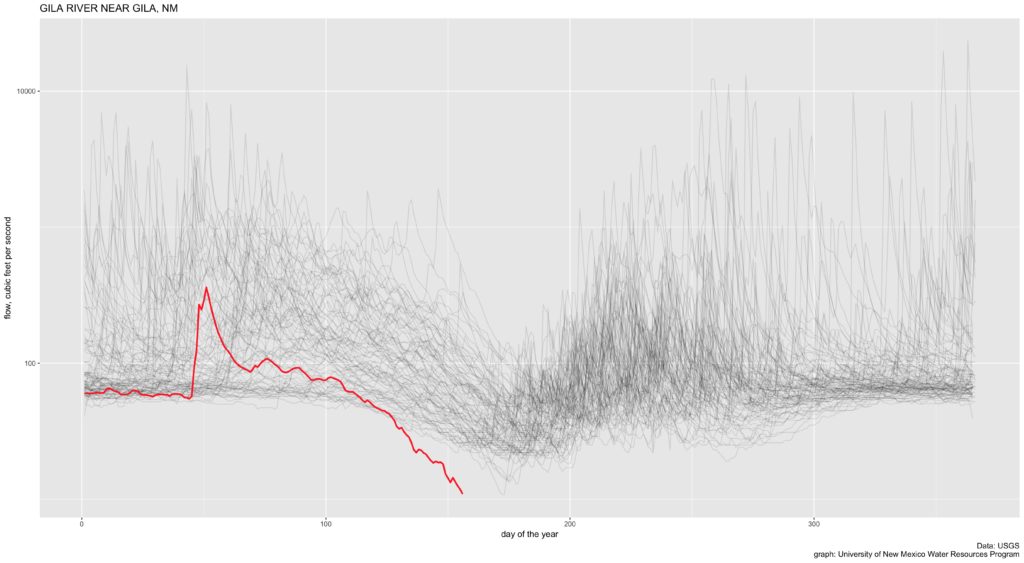
Record low flows on New Mexico’s Gila River
As I write this, the flow is 8.42 cubic feet per second. The previous record low came June 22, 2006, at 9.77 cfs. Look at how far that red line has dropped below the gray cloud. This is not simply a bad year. This is a far drier year than anything that river has seen in a very long time.
seen on the morning bike ride – this year *has* been quite dry
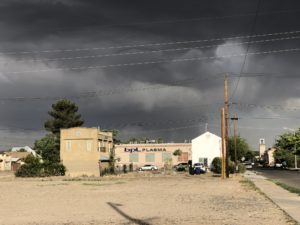
Storms over the plasma clinic in Albuquerque’s near south valley
Out bike riding yesterday morning, my friend Scot and I were watching the radar app and judging wind and storm direction, dodging the occasional raindrops with a spectacular sky around us. (In fact our ride was delayed because Scot had to put the goat in, something about lightning-goat risks.) But despite the stormy show, the morning brought very little rain.
The downpours didn’t start until afternoon, after we’d returned to the safety of our respective homes to enjoy the hailstorm with roofs over our heads. And after an extraordinarily dry water year (the third driest in more than a century of data for Albuquerque) it was most welcome.
But in the grand scheme of things, it wasn’t much at all.
The 0.57″ of rain at the Weather Service Albuquerque airport station brought us up to 1.45″ for the water year (which begins Oct. 1). That’s just 31 percent of average for this point in the year. It lifted us from the third driest to the sixth driest water year in records going back to the 1890s.
Trying to get a feel for the impact on the Rio Grande, I checked the river gauge at Bernardo, which last week had dropped below 10 cubic feet per second of flow. By way of comparison, the median for this time of year is 2,500 cfs, a couple of orders of magnitude higher. Bernardo is down in the reach of the river where we’ve been starting to see drying. It also was at the heart of yesterday’s storm, with 1.5″ recorded in a volunteer’s gauge in Jarales just upstream. The Bernardo gauge got nice bump up to 160 cfs yesterday evening, which is still an order of magnitude below normal for this time of year.
So yes, we enjoyed it. But a line of thunderstorms blowing through on a June afternoon can’t begin to make up for the lack of the widespread mountain snowstorms over the course of an entire winter.
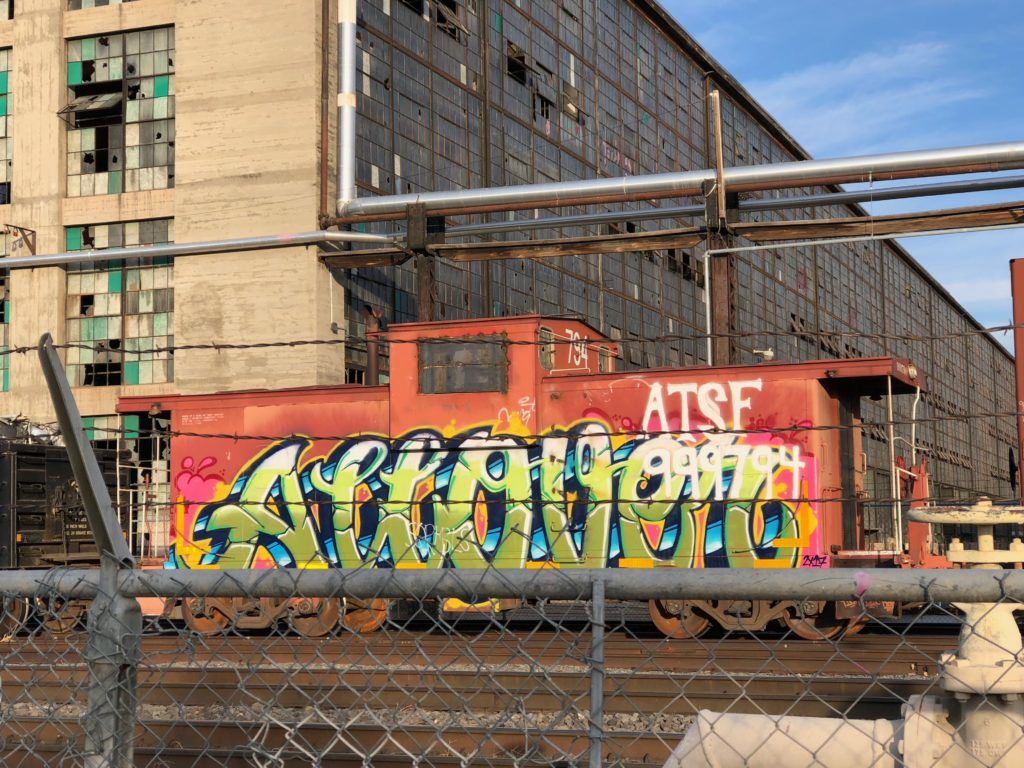
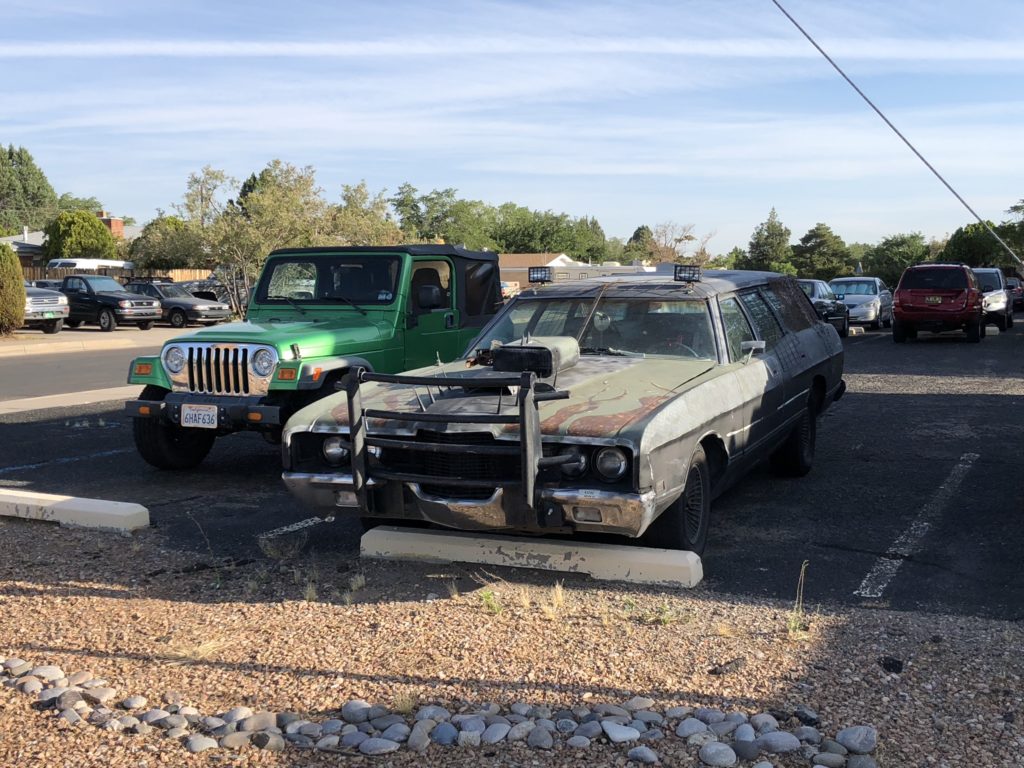
ATSF 999794
The artists helpfully made sure the caboose’s ID number was still visible.
update: According to the twitter hivemind (thanks @kzodasnowman and @evanheisman!) the artists leave the numbers exposed (or in this case repaint them in big letters on top of the art) so the railroad people won’t come and paint over the art.
Also, there’s a trainspotting web site with a bunch of pictures of ATSF 999794 through history!
A new analysis suggests Lake Powell could crash in less than three years if there were to be a repeat of drought (aridification?) conditions seen in the recent past.
While the basin community’s attention has been focused on the risk of Lake Mead plummeting at some point in the future, Lake Powell at the bottom of the Upper Colorado River Basin is likely to drop 32 feet this year. This is happening in the Upper Basin now, and a couple more drought years could make it scarily worse.
32 feet in Powell is 3.2 million acre feet of water – equivalent to more than an entire years’ use in the Imperial Irrigation District, the largest water user in the Colorado River Basin.
Some work done as part of a new analysis being done by The Nature Conservancy (shared here with permission) shows just how quickly Lake Powell can crash. While discussions about risks to Lake Mead hinge on complicated water policy discussions, the crashing of Lake Powell can be the result of simple hydrology. Simple very bad hydrology that is. But we don’t need scary worst case tree ring stuff or hypothetical climate change hydrology. We just need a repeat of any the three most recent droughts in the last three decades. That’s a discomforting “return interval”, to use the hydrologist lingo.
The difference is that the last three times, the droughts happened with relatively large reserves in the reservoirs. That cushion is gone:
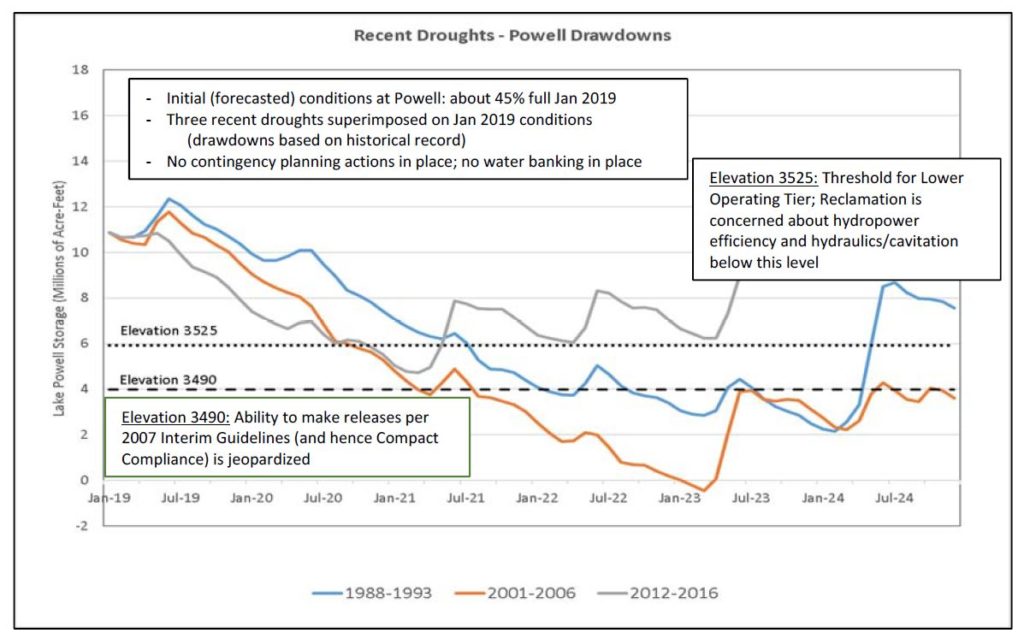
Crashing Lake Powell. Courtesy TNC.
This is the explanation for the “how to crash Lake Mead” graph from U.S. Bureau of Reclamation Commissioner Brenda Burman I wrote about yesterday. That orangy line in the TNC graph models the same period as Burman’s “crashing Lake Mead” graph from yesterday’s post – a repeat of the drought years of the early 21st century. As the levels of Lake Powell decline, under the operating rules less water will be released from Powell into Lake Mead. So as Powell crashes, Mead crashes with it. These two reservoirs, and therefore the fates of water users in both basins, are inextricably linked.
Elevation 3,490 in Lake Powell doesn’t get the same amount of ink that 1,075 or 1,050 or 1,020 in Lake Mead get. But it’s an equally scary proposition. 3,525 is kind of a safety line, like 1,075 in Mead. Below that, we should be very nervous. As the graph in the TNC analysis points out, at 3,490 “Ability to make releases per 2007 Interim Guidelines (and hence Compact Compliance) is jeopardized.”