On Sunday, I crashed Lake Mead.

Crashing Lake Mead

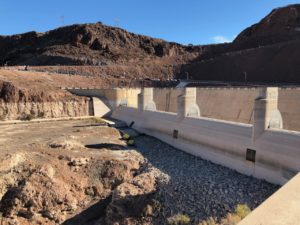
Sunday afternoon, I crashed Lake Mead.

This was not difficult.

Each spring, UNM Water Resources Program students do a case study of a river basin as they’re learning dynamic simulation modeling, linking hydrology, economics, and rules. This year, we’re doing the Lower Colorado River Basin.

In the WRP curriculum, we’re big on understanding the rules by which we manage water as a resource – where they come from, and how they work.

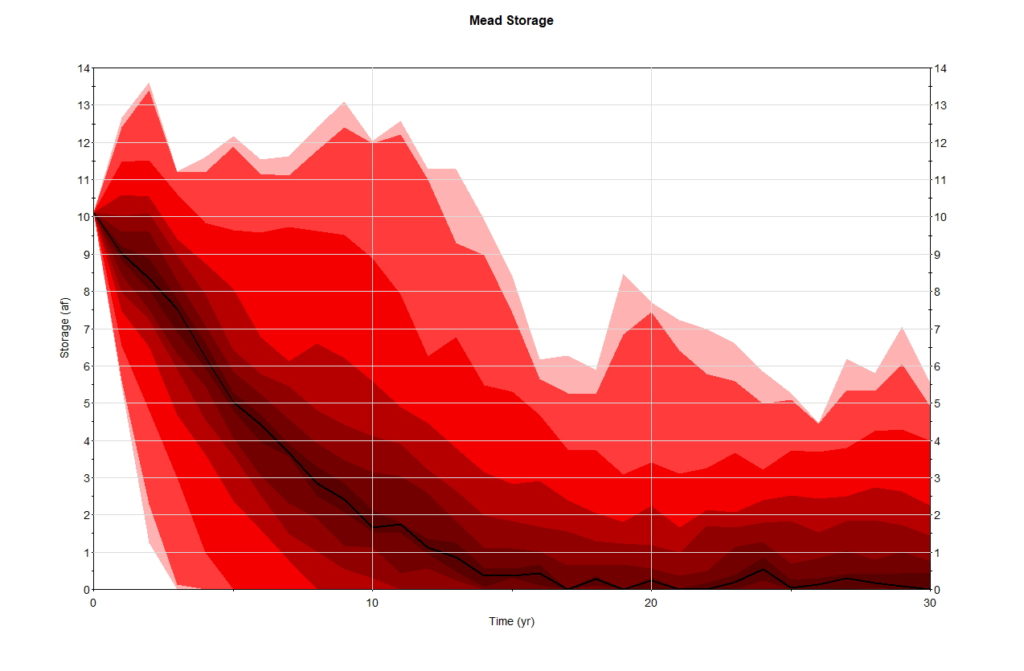
The model results above are a perfect example of George Box’s famous dictum that “all models are wrong but some are useful.” The Goldsim model, which I wrote really fast because I needed something for tomorrow’s lecture, is a super-simple simulation of the water allocation hydrology and rules in the classic Bureau of Reclamation “structural deficit” slide, combined with a Monte Carlo simulation of some reasonable assumptions by me about 21st century inflow hydrology from the Upper Colorado River Basin.

Within a decade in my model, Lake Mead is kinda unusable, doing little more than passing through whatever water comes down from upstream. Under some scenarios, my simulation quickly throws an error, informing me that you can’t have negative water in a reservoir.

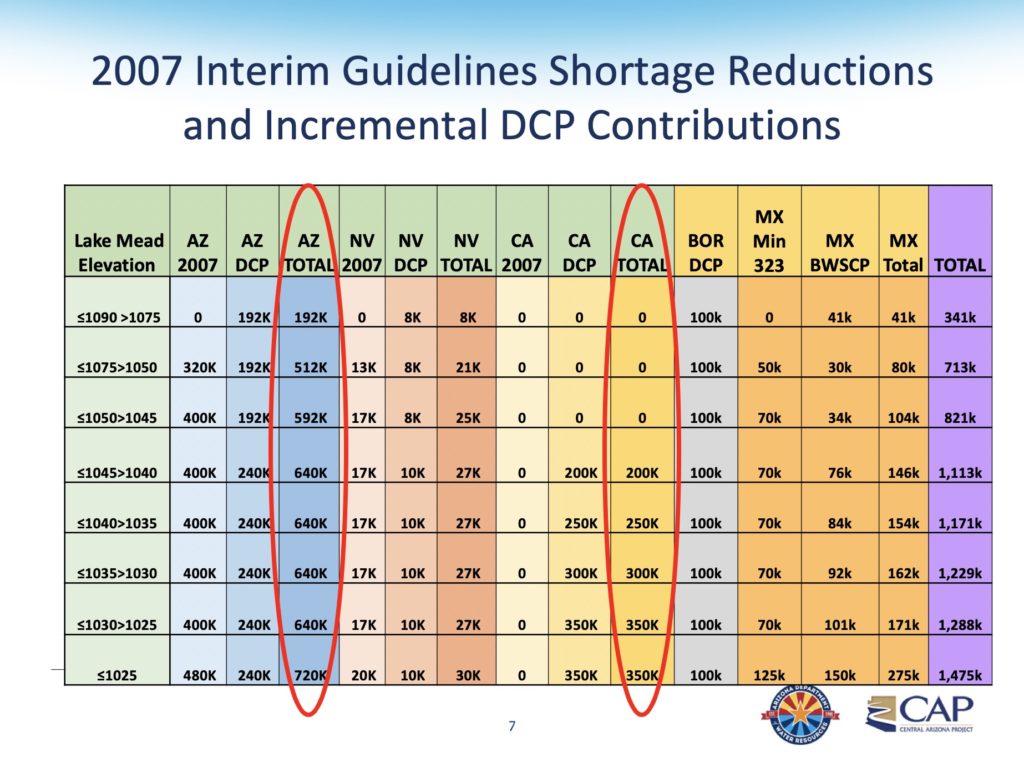
The rules here, which govern now much water gets released from the reservoir, are encoded in the Colorado River Compact and the Boulder Canyon Project Act, as interpreted by the U.S. Supreme Court in the 1963 Arizona v. California decision.

Obviously this is the “all models are wrong” part of Box’s dictum. This is a realistic view of the system if we don’t do anything. It’s not a realistic view of the system because it assumes people won’t say “OMG Lake Mead is almost empty we’ve gotta do something!” Which is what they’re now saying, which is why new and better rules are being written.

This spring’s assignment to our water resources students is to experiment with ideas about what those new rules might look like, how they might work.

I’m very much looking forward to this. I think it will be useful.

#tbt to that time Lake Mead was full

That time Lake Mead was full.

In keeping with Twitter’s “Throwback Thursday” (#tbt) tradition, I offered up this picture today of Lake Mead, full. As near as we’ve been able to determine, this was taken in 1987. Here’s a picture I took in December from near the same spot:

That time Lake Mead was kinda empty.

Colorado River data

Storage in lakes Mead and Powell

In the years I’ve been working on Colorado River stuff, I’ve collected a lot of data. Most of this is stuff the river managers at the Bureau of Reclamation have generously shared with me. Some I’ve assembled myself by transcribing old paper/pdf records of historic documents. Some of the Bureau’s most important data is already easily publicly available (most notably the Natural Flow Database, Lake Mead elevation, Upper Basin reservoir elevation and storage histories, and the 24-month studies). But over the years, the accumulation on my hard drive(s) has turned into a useful personal resource for my research and writing if I wanna look up, say, what the trends are in water use in Yuma or some such.

I’ve been meaning for a while to find a way to make what I’ve got more accessible. So I’ve started uploading data to Github. First up is the data for the graph above, for which I get a lot of requests. It’s total end-of-water-year storage in Lake Mead and Lake Powell, stitched together in a more easily usable form from a couple of different USBR datasets. I update my personal copy sorta monthly with the Bureau’s forecasts and make scary graphs to post on Twitter. (Scary Lake Mead graphs make great clickbait.) The stuff on Github is just actual year end numbers.

Two motivations: I’m teaching a Colorado River-related course this spring at the University of New Mexico Water Resources Program – we’ll need data! And as Eric Kuhn and I finish up the new book, we’re starting to think about how to make the key data and documents used in the book easily available. Not sure this is the platform, but this’ll give me an experimental toy to think about how to do it.

MWD increases its Lake Mead withdrawals


For background:

Meanwhile the Metropolitan Water District of Southern California has increased the pressure with an ultimatum of its own. Absent a DCP, Met is at risk under the current rules of having its banked water stranded in Lake Mead. DCP would relax those restrictions, but without a DCP, Met has made clear it has no choice but begin taking that water out beginning in January. (Daniel Rothberg explains all this here.) This means Lake Mead drops faster, increasing everyone’s risk, but especially Arizona’s. (Tapping foot, glaring, arms crossed, at Arizona.)

Happy New Year, Lake Mead dropped another foot in 2018

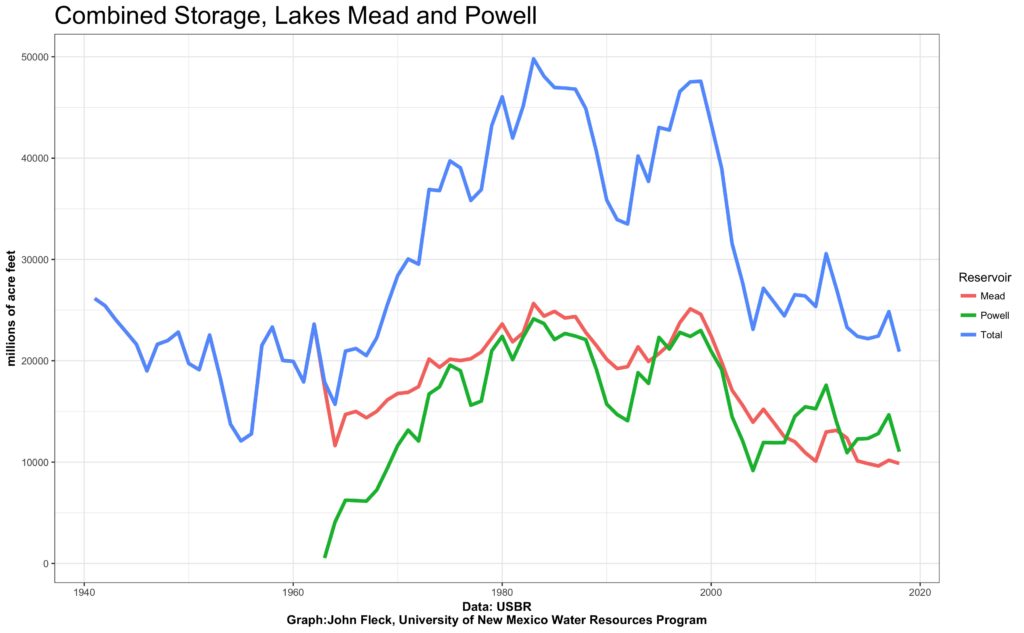
By the numbers, Lake Mead began 2019 at elevation 1,081.47 feet above sea level, down a foot in 2018. This comes in spite of yet another Upper Basin release of 9 million acre feet from Glen Canyon Dam last year, an extra 770,000 acre feet above the 8.23 million acre feet the Lower Basin can rightly expect under the Law of the River. Since 2000, the Upper Basin has delivered an excess of 9.8 million acre feet from Glen Canyon Dam above and beyond the 8.23 million acre feet expected every year under the current interpretation of the Law of the River. In that time, the level of Lake Mead has declined 115 feet.

Worth repeating.

In the 21st century, water users in the Lower Basin have received 9.8 million acre feet of bonus water, above and beyond their legal expectation under the Law of the River. This is not about climate change or drought. This is about using too much water.

Eric Kuhn and I are in the finishing stages of a new book looking at the history of our understanding of the hydrology of the Colorado River – what we knew about how much water the river really has, and how that knowledge shaped river management institutions. I don’t want to give away too much here (Buy our book! As soon as it’s published!), but our reading of the history makes clear that this situation was essentially known or knowable a century ago.

the now-superfluous spillways of Hoover Dam

Over the winter break, in clarifying some of the book’s final bits, I’ve revisited John Wesley Powell’s Report on the Lands of the Arid Region. As the historian Sara Porterfield pointed out at last year’s Colorado Mesa University Upper Basin Forum (a bit of her argument here), Powell hagiography has become an intellectual crutch, but he’s nevertheless a good guide. In the 1878 introduction to the first edition of Arid Lands, Powell talked about the crucial interplay between three things: descriptive science (How much water is there?), engineering (What kind of stuff can we build to use the water?), and institutions (What kind of rules do we need to govern the cooperative enterprise needed to pull this off?). He and others of the day I’ve been reading use a funky old word that I like to describe what is needed – “prevision”. By this they mean a sort of foresight, a prognostication. “[A] wise prevision, embodied in carefully considered legislation, is necessary,” Powell wrote.

This is the bit that isn’t working so well.

If you look at the math, it was abundantly clear by 2000 that, as Terry Fulp noted in a passage in my last book, “Lake Mead will go down.” (You can go ahead and buy it now, or wait until March it’s coming out in paperback.) Our “prevision” hasn’t been so great.


“What happens if we turn here?”

Alley, Albuquerque’s Old Town

I turned down this alley in Albuquerque’s Old Town on a bike ride this morning, amazed that I’d never noticed it before.

I spend a lot of time on the bike. I’m long past my youthful zoomy lifestyle, but in my slow and plodding way I have come to deeply value my time wandering Albuquerque. My friend Maria Lane (an actual professor of geography) calls it “geography by bike”. It’s based on a “what happens if we turn left here” approach to my city, and this year I logged 4,400 miles of it, nearly all here in Albuquerque. After a few years of working too hard and riding too little, it’s rejuvenated my view of my city. And me. Remember that feeling of freedom when you were a kid and grabbed a sack lunch and rode off to wherever?

And yes, I know the number of miles. Yes, I am a geek. Yes, I GPS every ride.

John’s geeky 2018 Albuquerque bike ride map

And I try to hit all the alleys.

DCP by the numbers

I’m forever needing to look up these numbers, sticking them here so I can find them easily, and y’all can as well. It’s the cuts by Lake Mead elevation levels for the various parties under the Colorado River Drought Contingency Plan and the related Minute 323 between the U.S. and Mexico:

DCP cuts

Megadrought

In the southwest….

“The last 19 years have been equivalent to the worst 19 years of the worst mega-droughts on record,” said Park Williams, a professor of bioclimatology at Columbia University, at a presentation of the work. Only three recent mega-droughts—in the late 800s, the mid-1100s, and the late 1500s—were worse than the current period, he added.

Climate change seems to be driving a good chunk of the problem. “The current drought is substantially worse than it would have been without global warming,” Williams said. The drought was 62 percent more severe than it would have been, he said, due to human-caused climate change.

Robinson Meyer on new work by Lamont-Doherty’s Park Williams