The Salton Sea: “treat it as a real place that impacts real people’s lives”

Shorline left by a shrinking Salton Sea.

Salton Sea, June 2019

Imperial Valley resident (and Imperial Irrigation District board member) Jim Hanks:

The Salton Sea is a real place to me and I have always seen it as a lake, because that’s what it is. I also see it as hydrologically, geographically and morally connected to the Colorado River, and I appreciate the effort to place the Salton Sea issue in the context of a broader discussion within the river community, which is where I think it belongs.

“Hydrologically, geographically and morally connected” – that’s a nice bit of business there.

The biggest year since 1995 on New Mexico’s Middle Rio Grande

Near the peak – the Rio Grande near San Felipe, May 2019

Thanks to continued high flows, this is now the wettest year on New Mexico’s Middle Rio Grande since 1995.

My measurement point is the San Felipe gauge on the Rio Grande in north-central New Mexico. The measure is total flow to date this year, compared to total flows at this point in all previous years going back to 1927.

I use the San Felipe gauge for two reasons. First, it is one of the older gauges on the river, and the oldest in the reach that flows through the greater Albuquerque area. Second, it is above several significant diversions – one agricultural at Angostura, the other municipal at Alameda. Thus it more accurately captures flow into the valley before we start skimming off water to do stuff with.

San Felipe gauge

At the Central Avenue bridge, another important measurement point, we’ve had the largest year-to-date flow since 2005. With continued high flows, we may yet surpass 2005 at Central as well.

Resilience and my little Rio Grande sandbar island

Rio Grande sandbar island emerges from a high flow year

resilience

Since early spring, I’ve taken my early morning bike ride through downtown Albuquerque to the old Route 66 crossing of the Rio Grande. Every time, I’ve stopped to check out this little sandbar island, anchored by a tenacious community of willows. I started watching closely after I saw a pair of geese, frantic as the water rose to cover their nest.

For much of the last three months, the exposed sand you see here was covered in water, as we’ve seen the highest flow past this bridge since 2005.

2019 to date on the Rio Grande at Albuquerque


The flows here are attenuated, in part because Albuquerque’s municipal system takes water upstream of this point. But up at San Felipe, where we have a good gauge and a long record, we’re on track to record the biggest flow into this reach of the Rio Grande Valley since 1995.

On track for the biggest flow at San Felipe since 1995.

Every time I’ve been down, I’ve wondered if my little island would be gone. But this fascinating partnership of sandbar island and willow off the Central Avenue Bridge persists, emerging the past few trips as flows dropped below 2,000 cubic feet per second for the first time since early April.

Scholars have helpfully defined resilience as “the ability of a system to survive a shock while retaining its basic structure and function.” One of the important issues when invoking the resilience framework is what we include within our definition of the “system” (“Resilience of what, and for whom,” as my friend and colleague Mindy Benson frequently asks.). If our definition is to include the geese, my little island has failed the resilience test. But if we’re talking about the partnership of sandbar and willow, the basic structure and function remain intact.

Beyond the “Drought Contingency Plan” on the Colorado River

Brad Udall, Doug Kenney, and I wrote a thing about the Colorado River Drought Contingency Plan and what comes next:

The plan is historic: It acknowledges that southwestern states need to make deep water use reductions – including a large share from agriculture, which uses over 70% of the supply – to prevent Colorado River reservoirs from declining to critically low levels.

But it also has serious shortcomings. It runs for less than a decade, through 2026. And its name – “Drought Contingency Plan” – suggests a response to a temporary problem.

As scholars who have spent years researching water issues in the West, we know the Colorado River’s problems are anything but temporary. Its waters have already been over-allocated, based on a century of false optimism about available supply. In other words, states have been allowed to take out more than nature puts back in.

Key bit:

An effective long-term plan should solve the overuse problem in the Lower Basin, while preparing for extended and unprecedented low flows. It should revisit a number of long-standing assumptions about how the river is managed, including the Upper Basin’s so-called “delivery obligation” to the Lower Basin, which leaves the upper states – Wyoming, Utah, Colorado and New Mexico – bearing the burden of climate change, while the Lower Basin states remain free to overuse. And it will have to address the reality that there is not enough water for users in the Upper Basin to continue exporting ever more water to growing cities like St. George, Utah, and Colorado’s Front Range.

Big thanks to Jennifer Weeks and the folks at The Conversation for hosting and helping.

Upper Colorado River Basin water use: well below our compact allocation, not going up

tl;dr

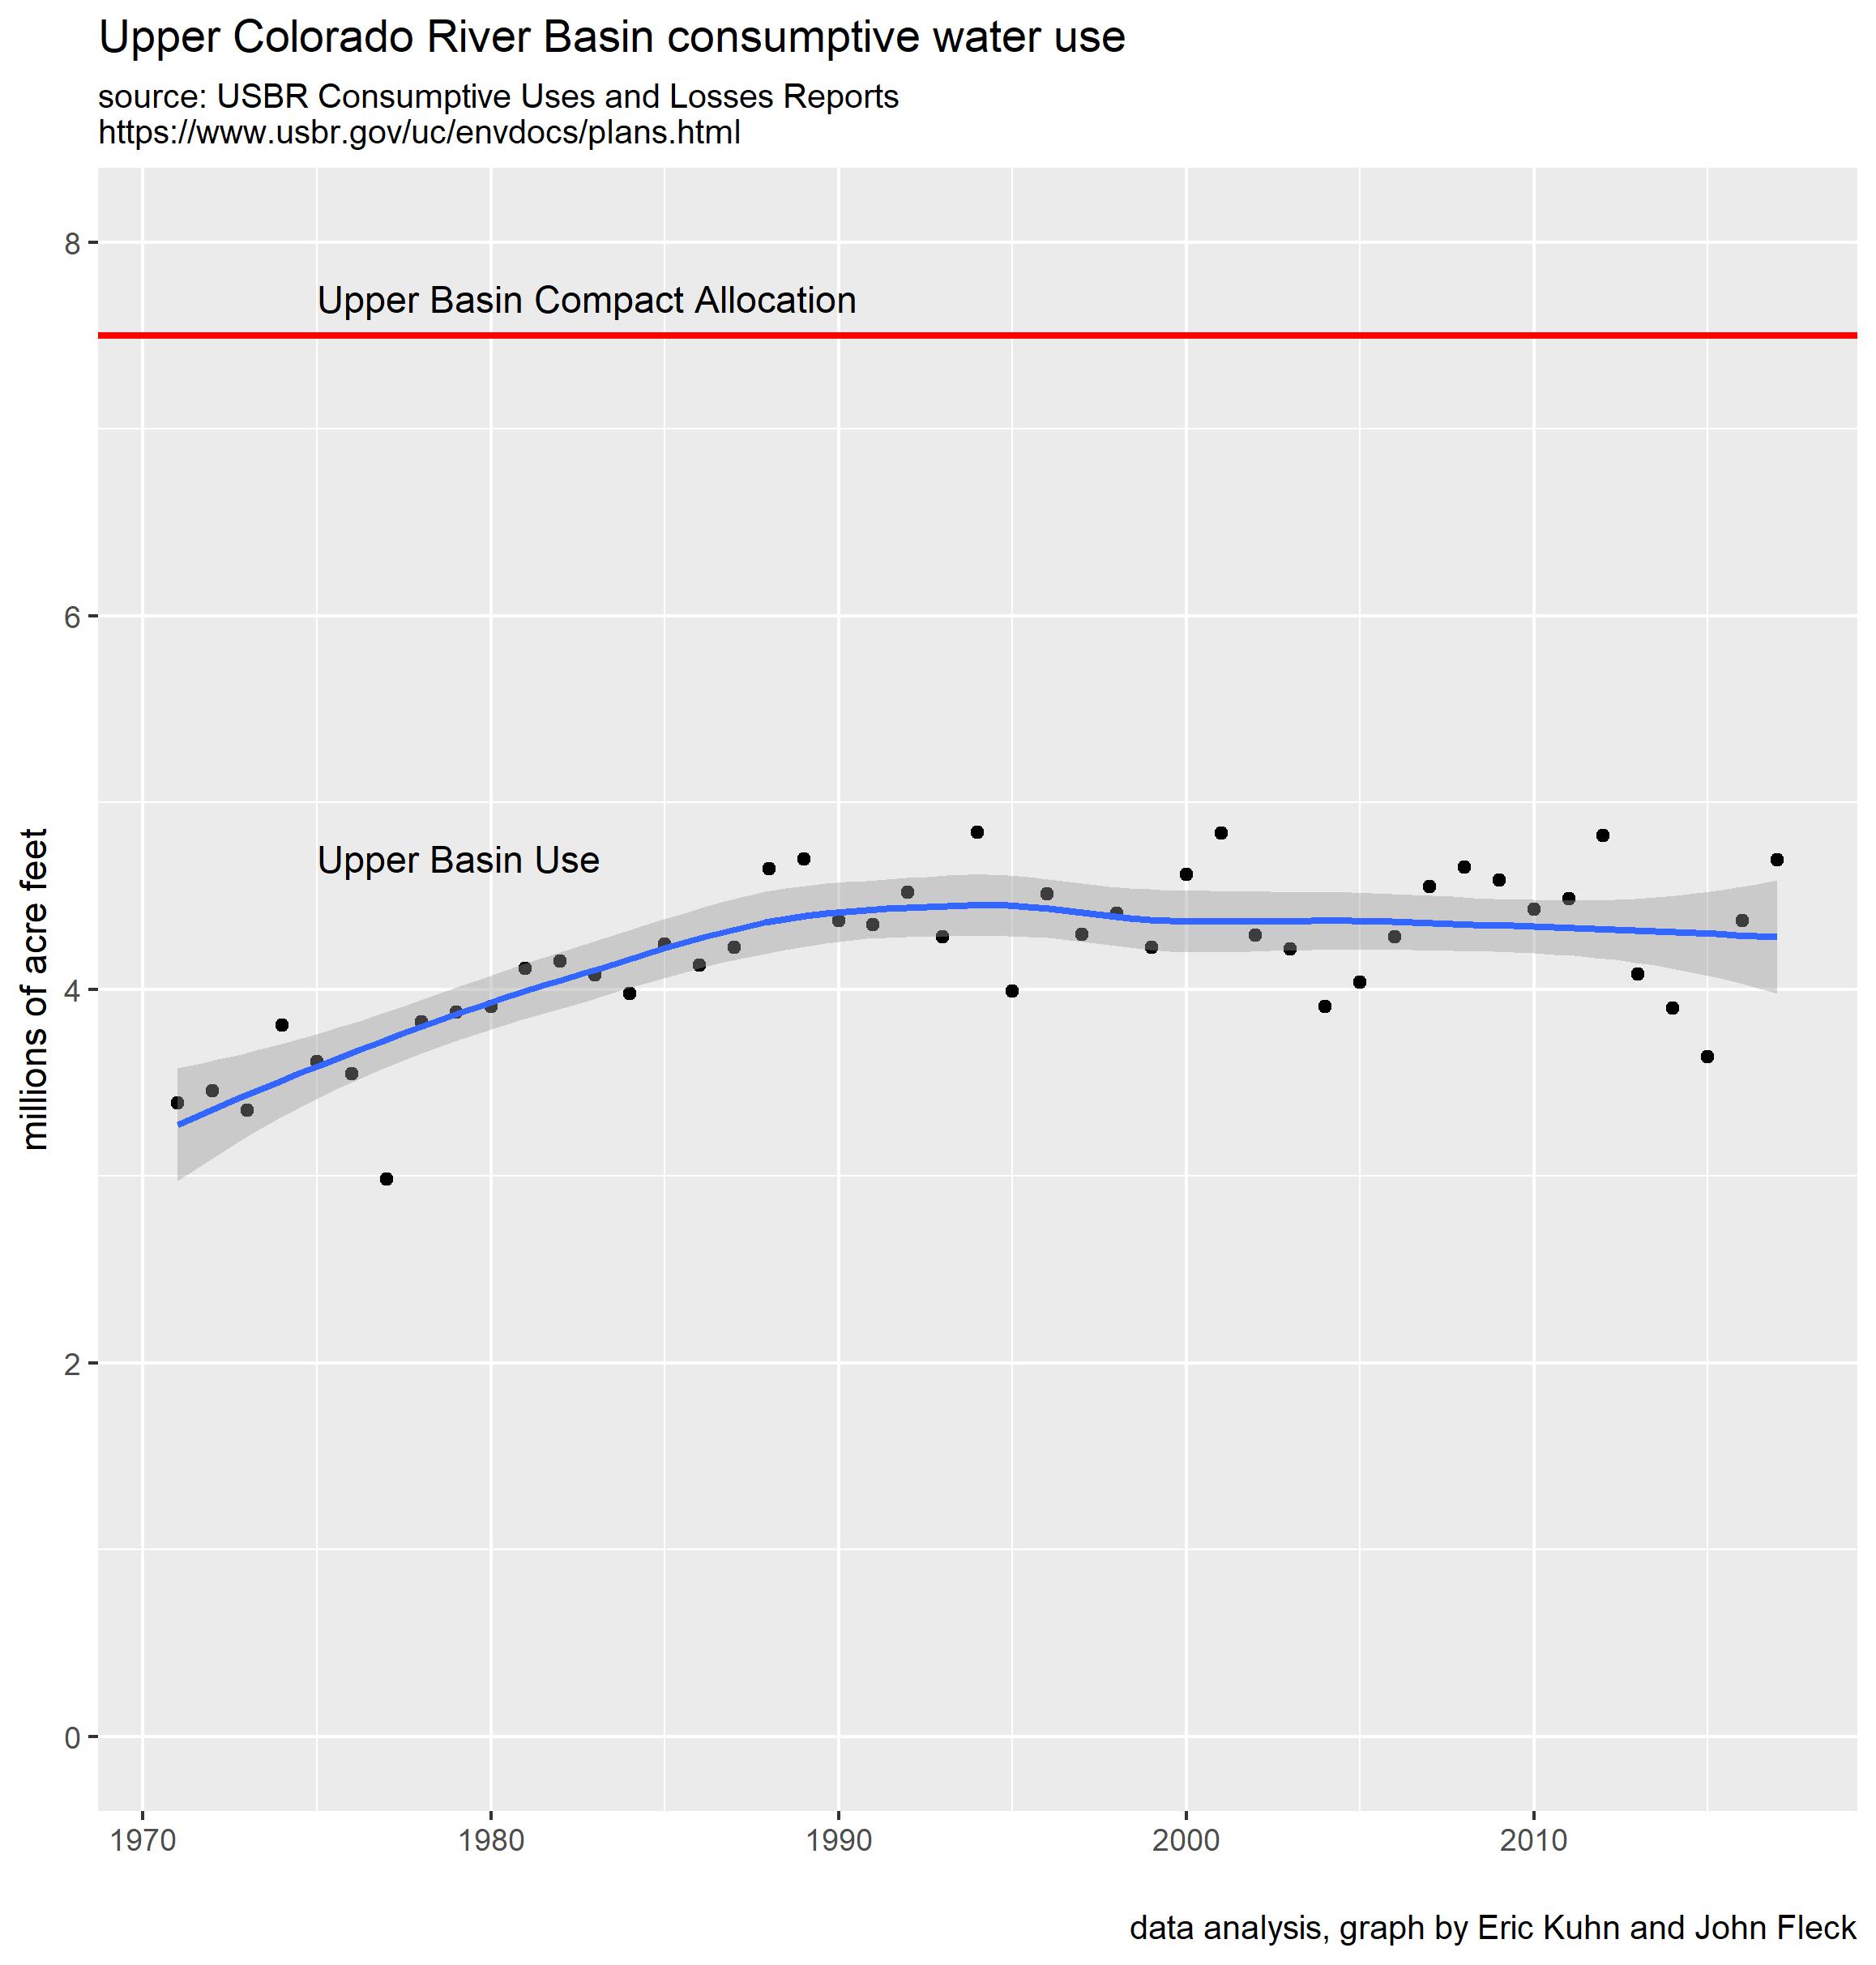
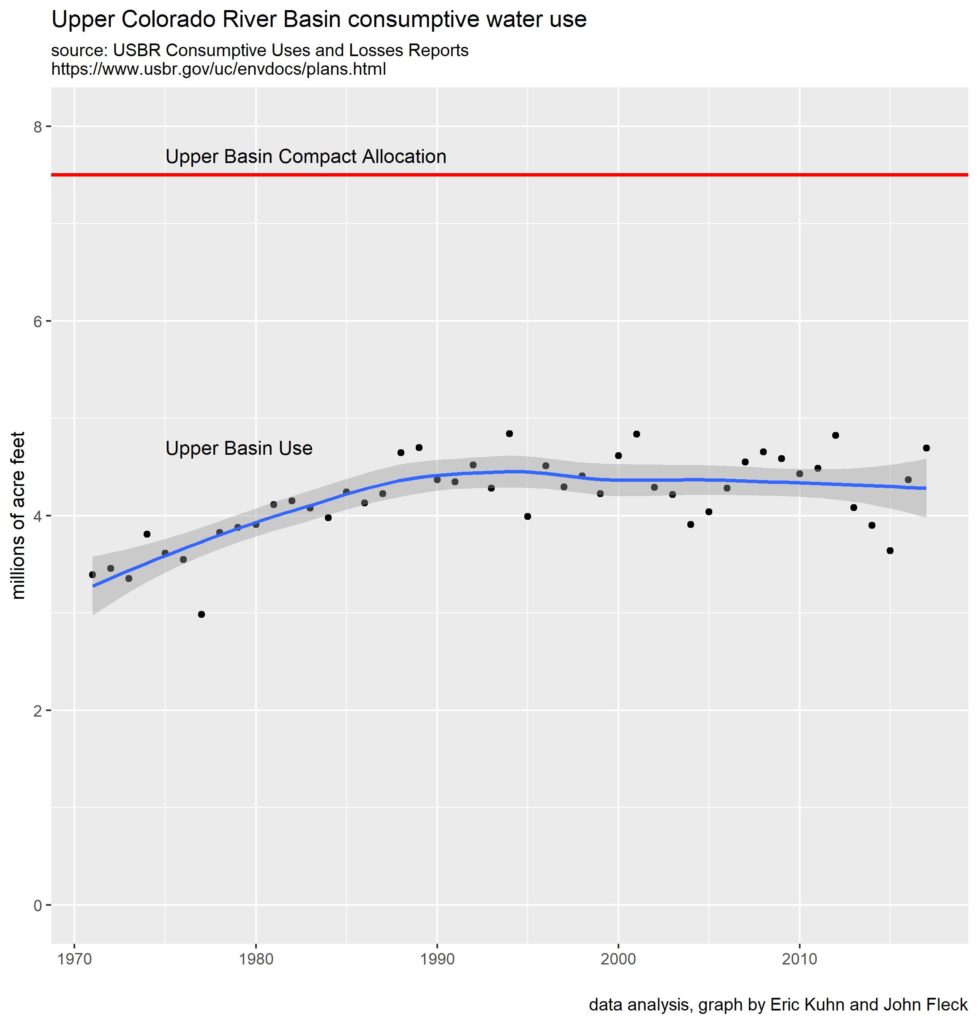
  1. Folks in the Upper Colorado River Basin are only using ~60 percent of their Colorado River Compact allocation
  2. Use has been basically flat since 1990. It is not going up.

Upper Colorado River Basin use

A couple of weeks ago I got an email, with an attached spreadsheet, from my co-author Eric Kuhn.  It was his distillation of data from the US Bureau of Reclamation’s Consumptive Uses and Losses Reports:

There are just no real trends in UB CU since 1988. A slight downward trend in over UB CU primarily because CRSP has been going down. No trend in UB exports or in-basin ag use.

Two days later, he sent an updated version, taking the main part of the dataset back to 1971.

Those who have worked with Eric will no doubt recognize two important characteristics – brevity, and data. (Re brevity: by “CRSP” here, he means evaporation from the Colorado River Storage Project reservoirs). After three years collaborating with Eric on a book about Colorado River data – what did we know, and when did we know it, about how much water the river has? – I’ve come to treasure Eric’s spreadsheets.

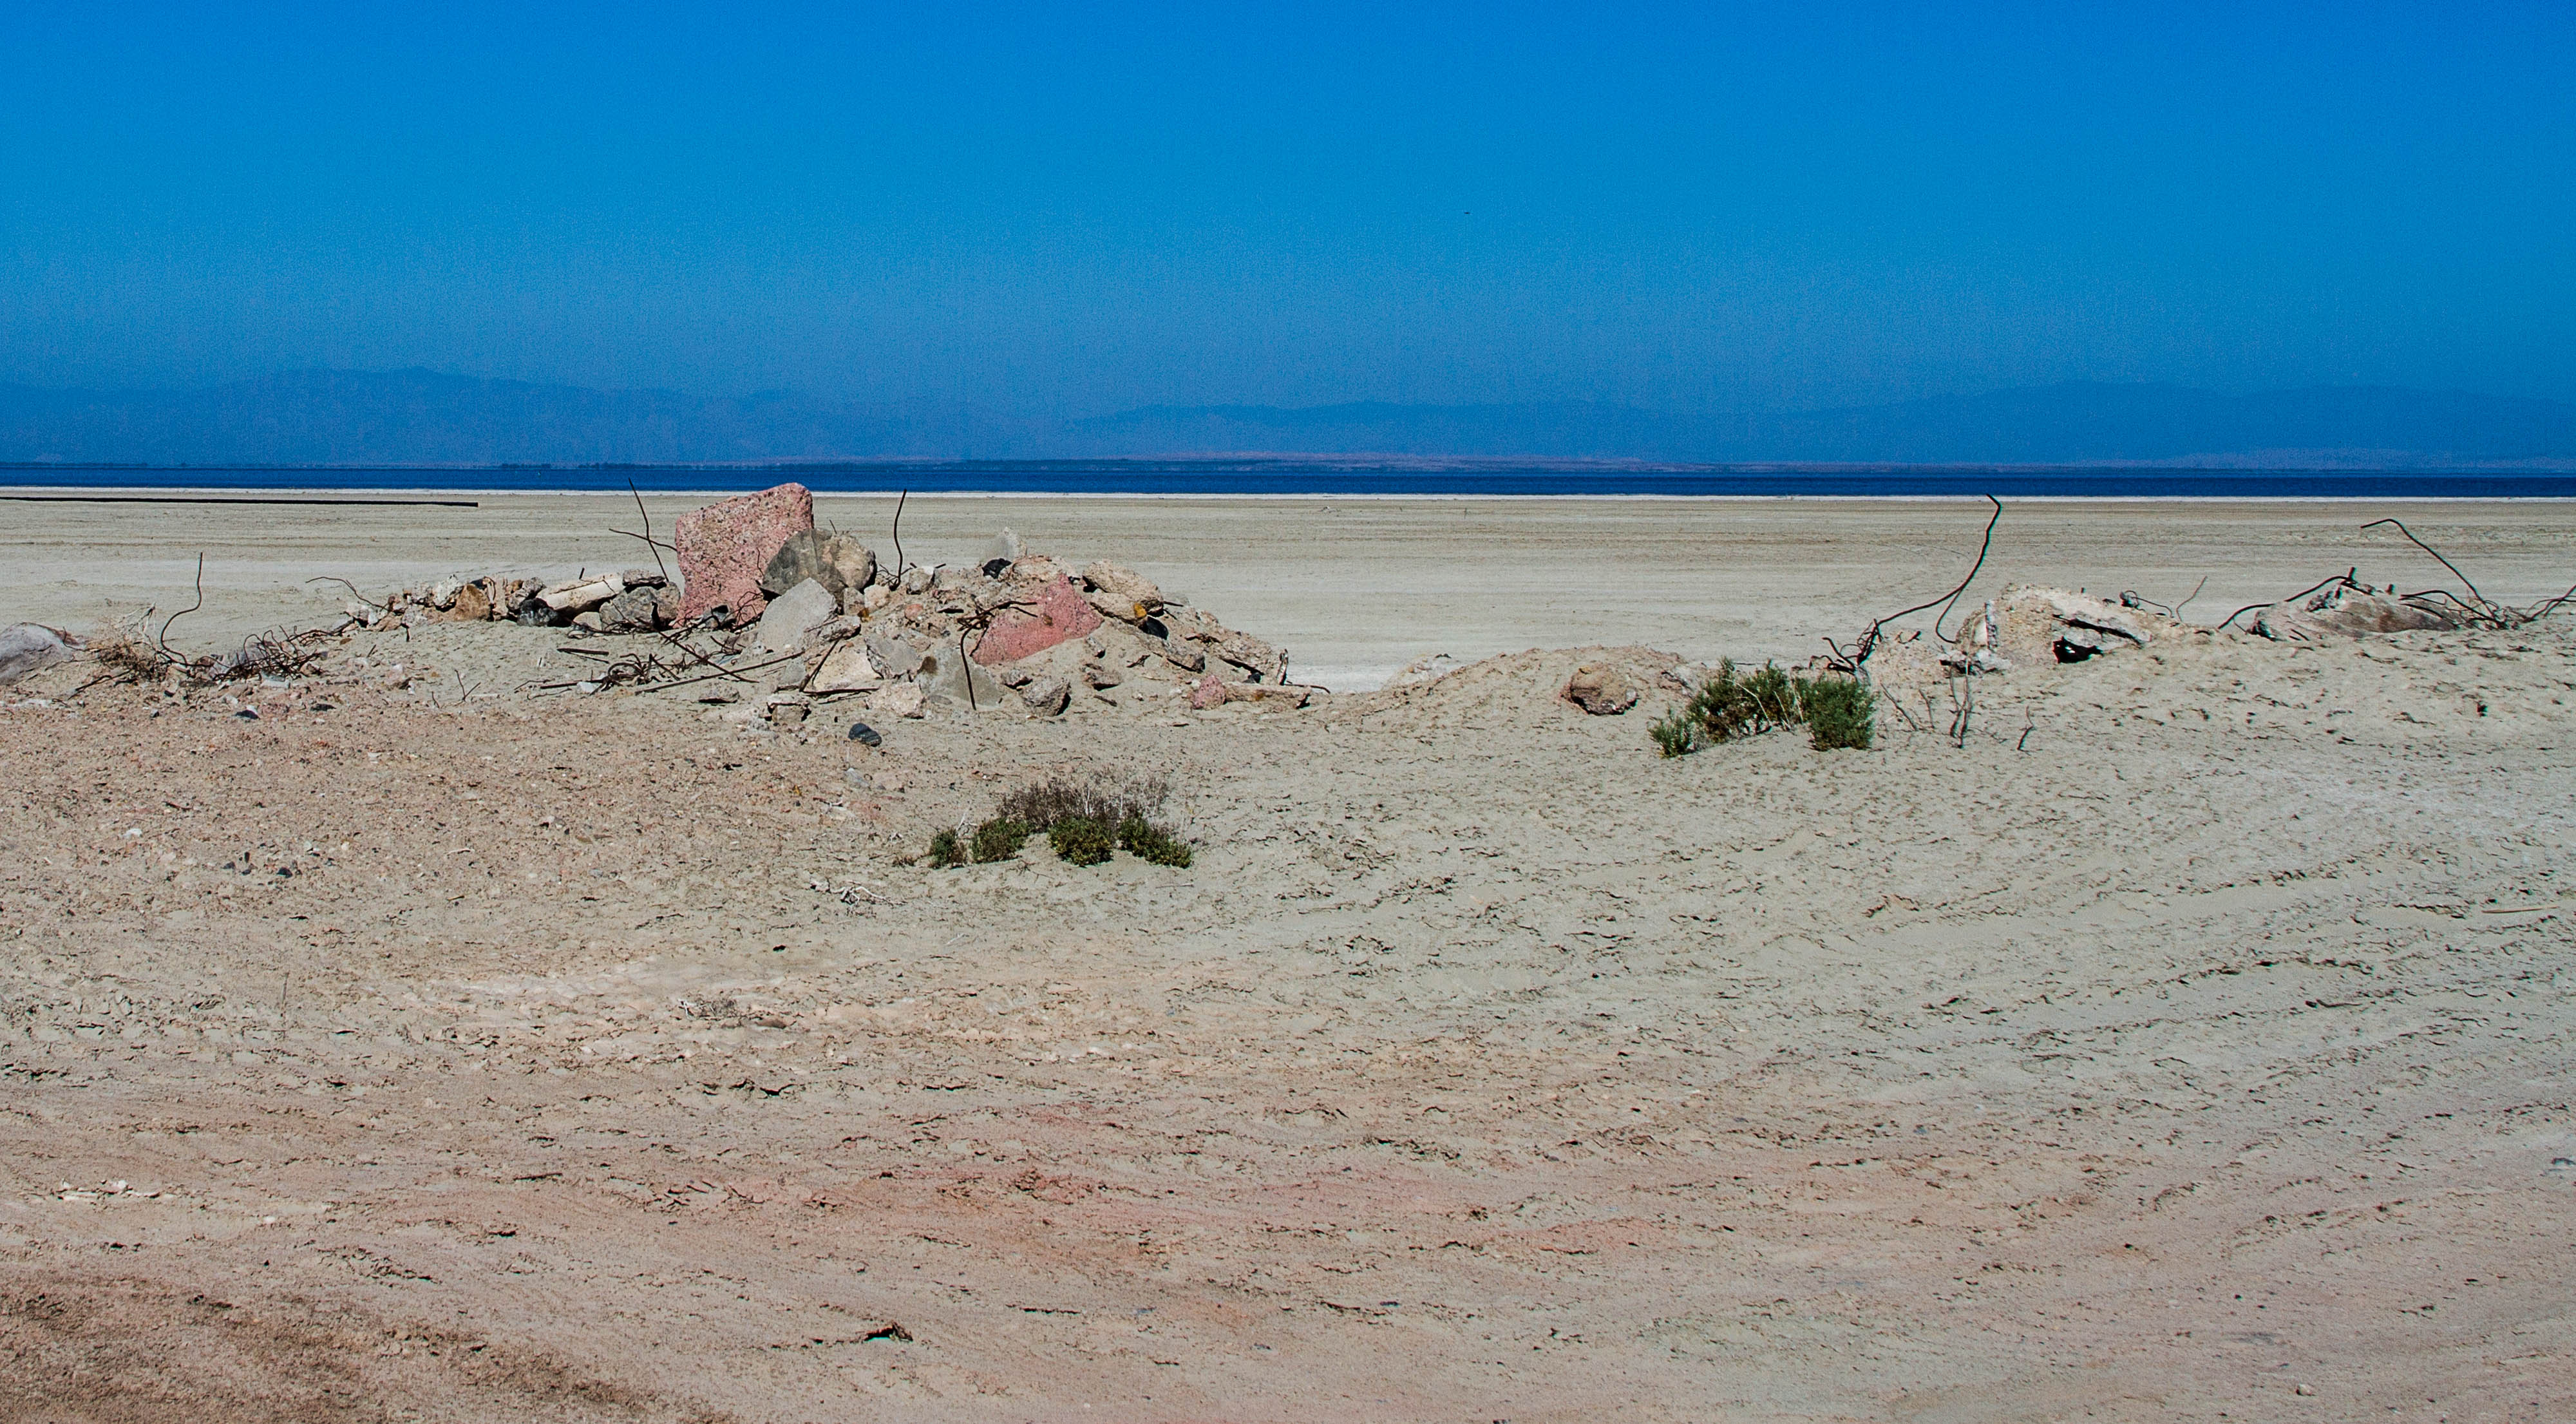
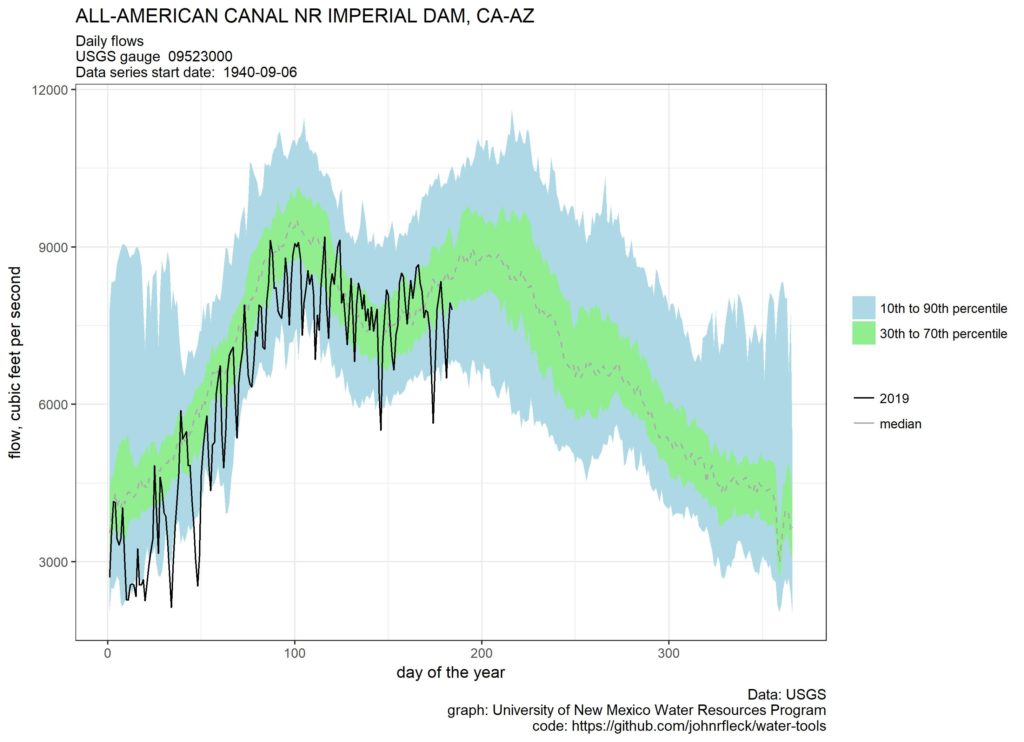
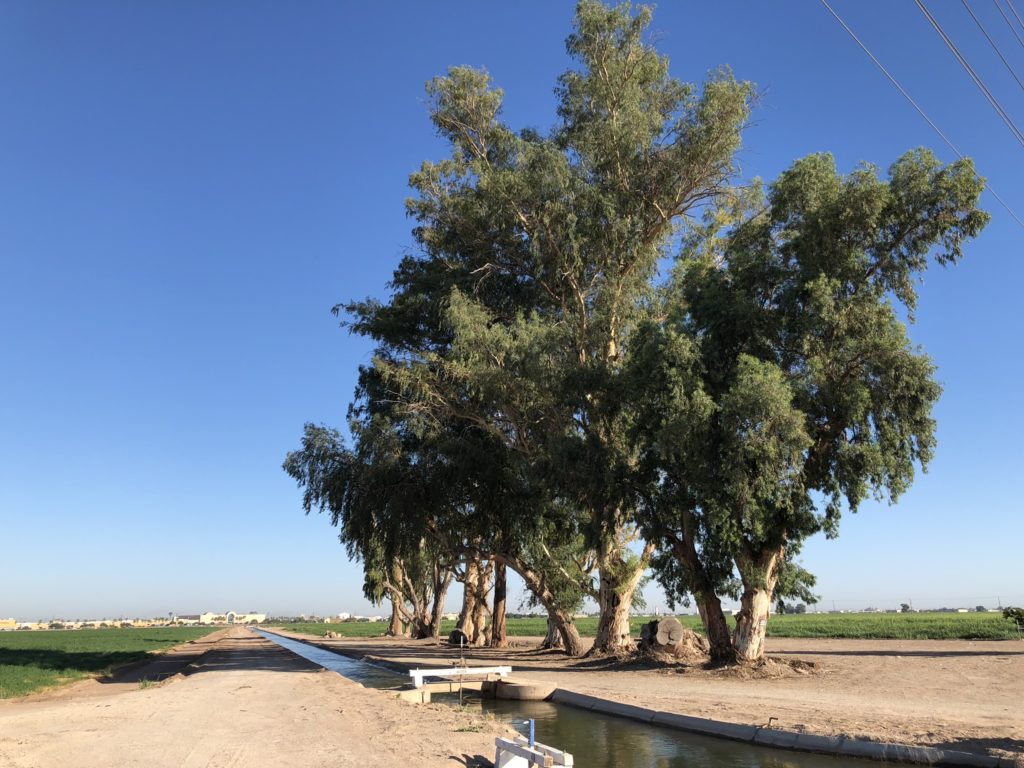
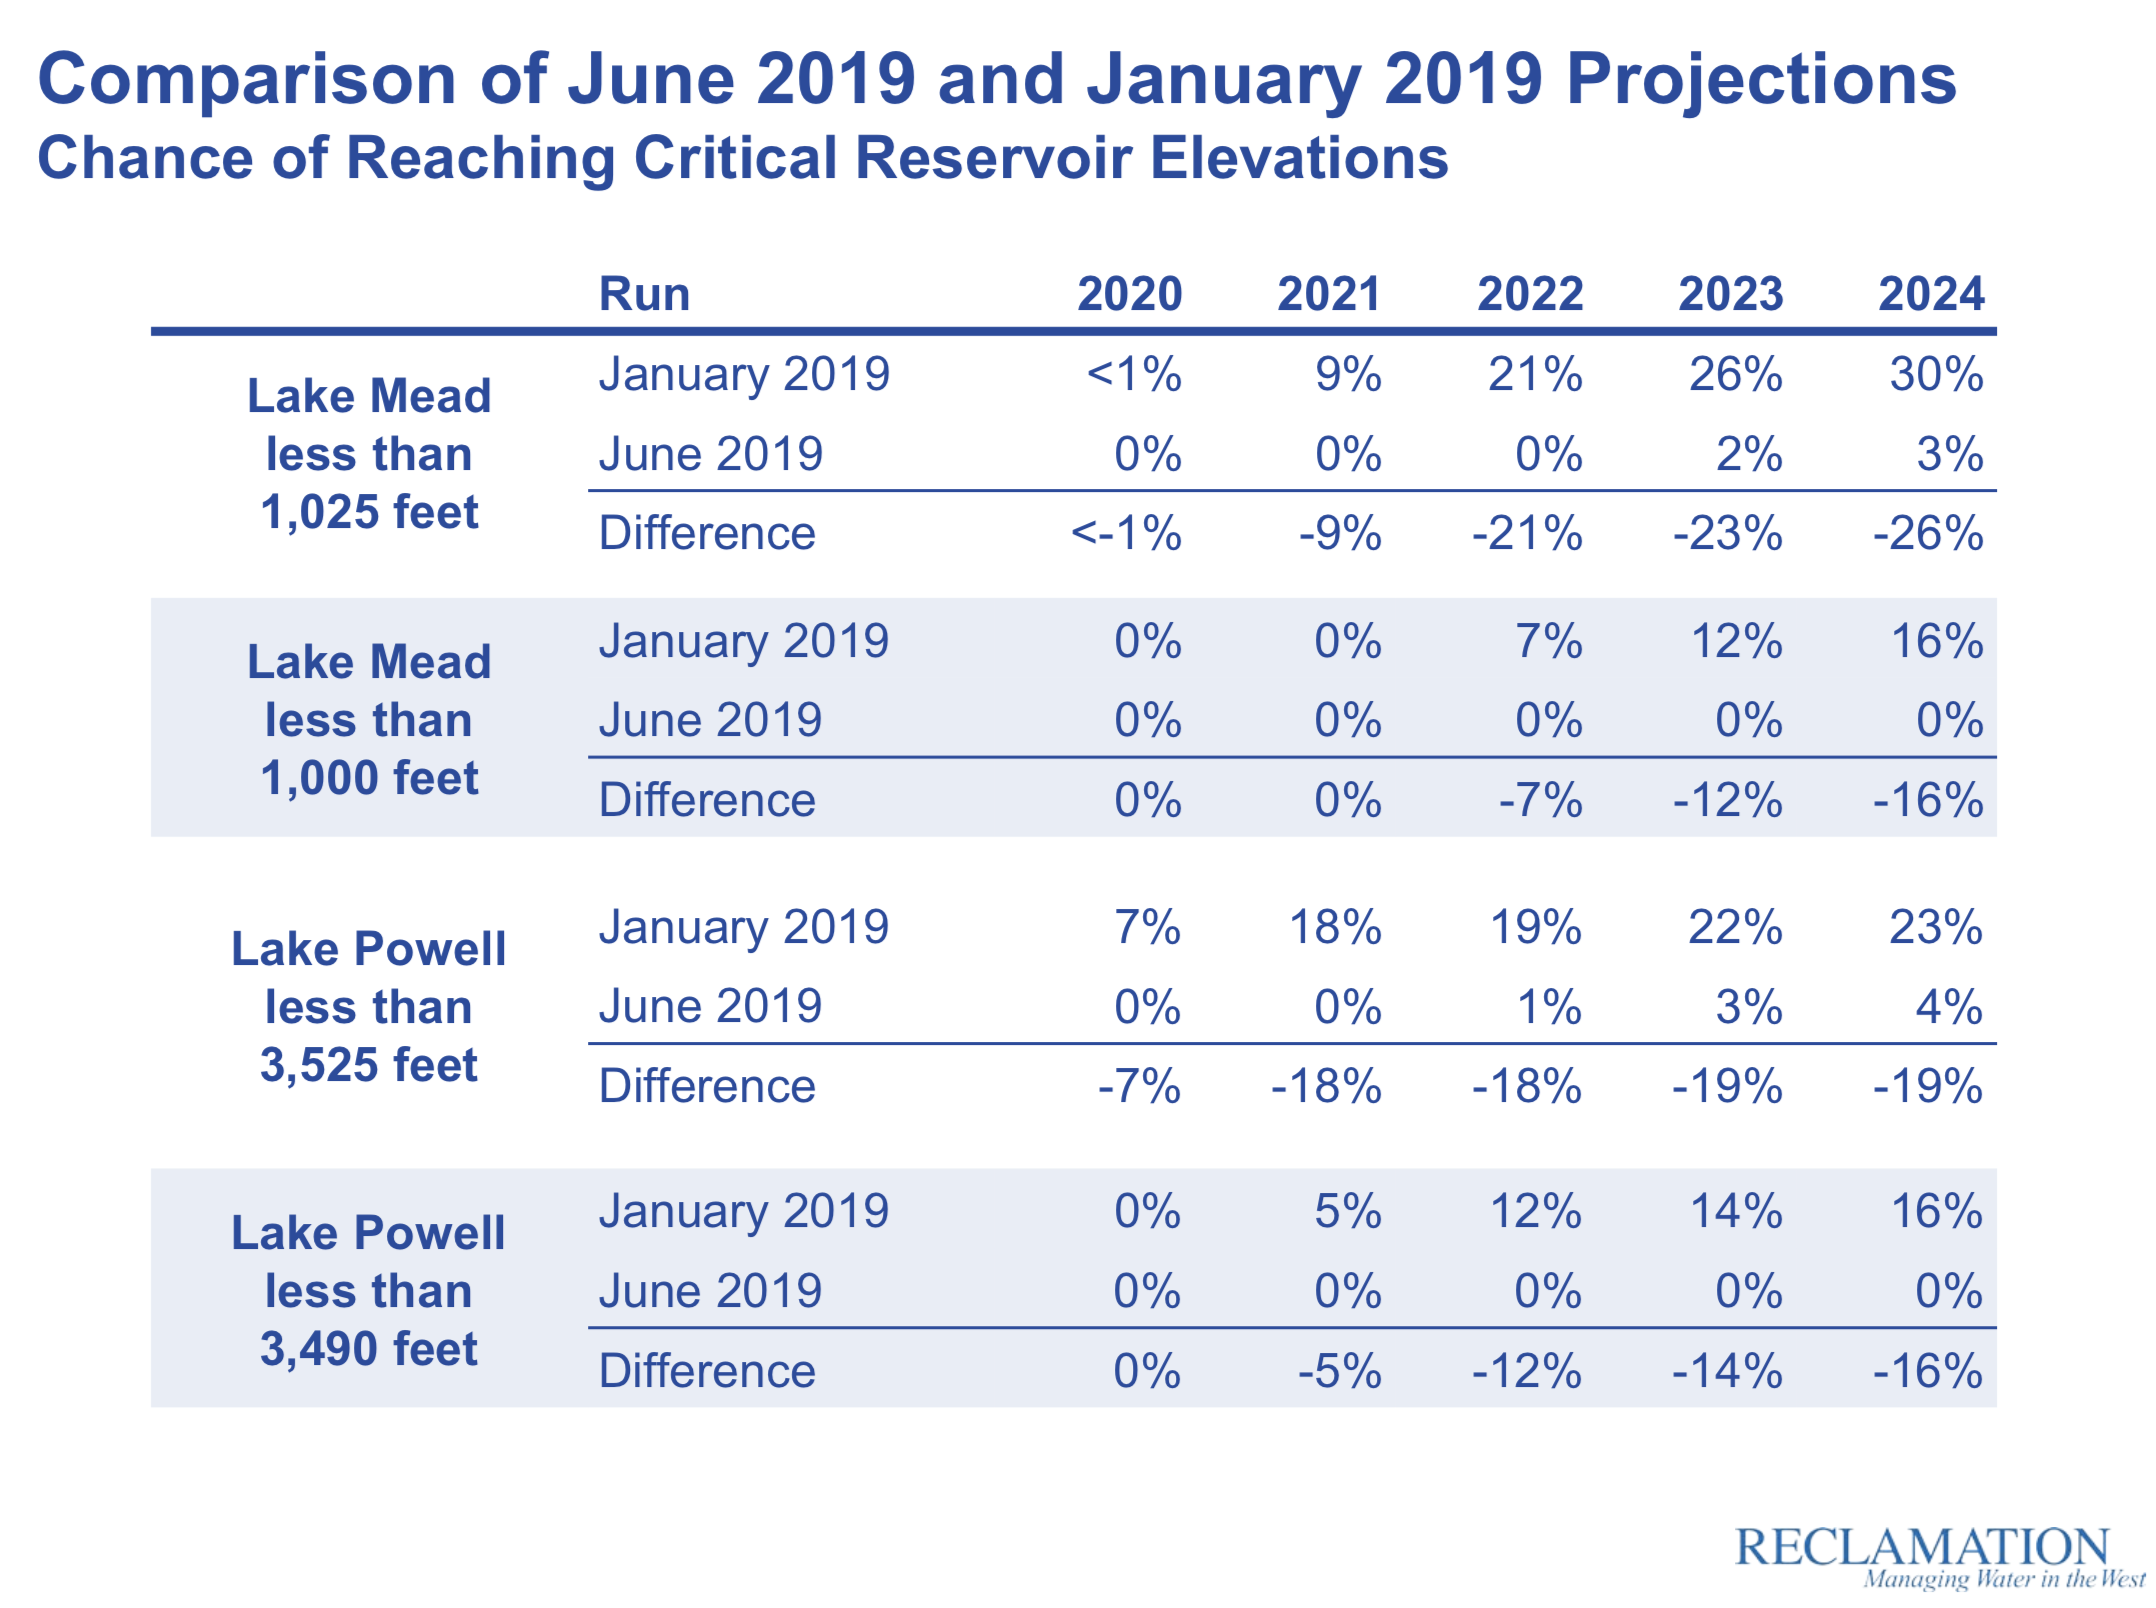
This latest one landed in my inbox as I was focused on a Lower Basin scouting trip, visiting the farms and water districts of the California deserts that use a big share of the Colorado River’s water. Folks in the Colorado River management community, myself included, tend to focus a huge share of our attention on the Lower Basin, where overuse has led to emptying reservoirs.

Eric’s spreadsheet, and our discussions surrounding the data it contains, pulled my focus  back upstream, to an important and under-discussed piece of the Colorado River story. While the Lower Basin is unquestionably overusing water, the Upper Basin is underusing.

Overuse is an attention-getter. Underuse, not so much.

As we negotiate a complex future under the strains of population growth and a climate-change-shrunk river, we need to keep this bit of data close to hand.


New Mexico’s shrinking Gila River diversion proposal shrinks some more

The 1946 Bureau of Reclamation report projecting future development of the Colorado River – “A Natural Menace Becomes a National Resources” was its subtitle – included a picture of Hoover Dam with the caption: “World’s highest dam only partly harnesses the wild Colorado River.” The report laid out a staggeringly ambitious plan for the rest of the harnessing, which included a southeastern most dot in the upper reaches of the Gila River in New Mexico: “Hooker Reservoir”. (giant pdf of the report)

More than seven decades later, Hooker Reservoir has not yet been built, nor will it likely ever be built. But the struggle over ever-more modest diversions from the Gila in New Mexico continues. At each phase of the debate, high costs have collided with the little water to be yielded by projects. As Laura Paskus reports, we’ve had another such collision:

At a meeting in Silver City on July 2, members of the New Mexico Central Arizona Project Entity voted to scale back development plans on the Gila River and one of its tributaries in southwestern New Mexico.

The vote took place following completion of a preliminary draft environmental impact statement (PDEIS) about the group’s plans in the Cliff-Gila Valley, on the San Francisco River and in Virden, a town in Hidalgo County near the Arizona border.

Click through for an excellent overview of the saga to date.


How Parker Dam might have been the Colorado River’s first

Parker Dam, Colorado River. June 22, 2019. By John Fleck

If you want to dam rivers, as we were inclined across much of the 20th century, the location of the current Parker Dam on the Lower Colorado River makes sense – a narrow gap just downstream from the confluence of the Colorado and Bill Williams rivers on the Arizona-California border.

I paid a visit last month on my Lower Colorado River trip to Parker Dam, which was built in the 1930s, in tandem with Hoover Dam, to create a stable surface for the pumping plant that supplies water Los Angeles, and later for the Central Arizona Project.

In one of the lesser-known bits of Colorado River history (where “lesser known” means “Fleck just learned this”), this almost became the very first dam on the Colorado River.

The proposal came in 1902 from Arthur Powell Davis, who later became head of the Reclamation Service (as the Bureau of Reclamation was then known). Davis was appointed the service’s Assistant Chief Engineer at its 1902 formation, fresh off of a tour of duty working on what would become the Panama Canal. The story of Davis’s first Colorado River Dam scheme is told by historian Donald Pisani:

He proposed four dams along the lower Colorado, the first at the mouth of the Williams River above Parker, Arizona. This “high dam” would capture enough water to irrigate 400,000 acres and generate electricity besides. And as it filled with silt, thousands of acres behind the dam, particularly flood plains, alkali flats, and other low-lying areas, would gradually be reclaimed or “produced”. After the silt destroyed the reservoir’s storage capacity, water could be released from the dam’s lower outlets, exposing the new farmland. Meanwhile, the Reclamation Service would have constructed another dam farther upstream. Eventually, Davis hoped that 1,200,000 acres could be reclaimed or created along the river.

Using a dam to “create” farmland. What a world it was back in 1902.

Updated to correct Davis’s work prior to joining Reclamation.


The hydrograph of the All-American Canal

With little water storage to speak of in the Imperial Valley, the flow of the All-American Canal west from Imperial Dam integrates, in close to real time, the collective decisions of a thousand farmers growing crops on half a million acres.

A “hydrograph” is a commonly used tool for looking at the flow of water past a measurement gauge over time. You put time on the “x” axis and flow on the “y” axis, to help visualize its ups and downs. There aren’t many natural hydrographs left to look at in the western United States, but I’m fascinated with human-intermediated ones.

I’ve written before about the “institutional hydrograph” on my Rio Grande, where we have an annual bump in flow as water is moved to meet end-of-year compact delivery obligations. On the All-American Canal, you can see – what – an “agronomic hydrograph”?

All-American Canal flows

I spent my holiday afternoon cleaning up some data visualization code I use to help me think about USGS gauge data. (On github here.) One of the gauges I tried it out on was the flow down the All-American Canal from Imperial Dam. The double peak is fascinating – heaviest water use in April, then a drop, then another peak in late July and early August.

It’s an agronomic hydrograph, driven in part by cropping patterns (the Imperial Irrigation District publishes wonderful data here summing up the collective behavior of the valley’s farmers) and partly the weather. August, I’m told, is really hot down there.

Farming the desert. El Centro, California, June 2019, by John Fleck

New USBR modeling shows substantial reduction in Mead, Powell risk over the next five years

The unusually wet winter (with an assist from new Colorado River Drought Contingency Plan water reduction rules) has substantially reduced the near-term scare-the-crap-out-of-me risks on the Colorado River for the next few years, according to new Bureau of Reclamation modeling.

Modeling done in January showed significant risk – a nearly one in three chance – of Lake Mead dropping below elevation 1,025 by 2024, a level that would place the reservoir’s long term ability to make deliveries at risk. That has dropped to a one-in-30 chance, according to the new USBR modeling.

At Lake Powell, the risk of reaching elevation 3,525, a danger point beyond which power generation and the Upper Basin’s ability to meet Colorado River Compact delivery obligations are at risk, has dropped from a one in four chance by 2024 to a one in 25 chance. The chance of dropping below Powell’s minimum power pool – the point at which the reservoir is too low to generate electricity – has dropped from one in six to essentially zero.

reduced risk of shortfalls at Lake Powell and Lake Mead

Details of the modeling results, presented today to basin water managers, suggest the bulk of the risk reduction is the result of the wet winter, which has pumped up runoff and reservoir storage. But the new Drought Contingency Plan, under which water users in the Lower Colorado River Basin have agreed to leave water in Lake Mead if and when it drops below critical thresholds, also played a role.

As I write this (Monday evening, July 1), you can find the old model results here. The new ones aren’t posted yet, but by tomorrow (July 2) the new ones should be posted at the same link.