Albuquerque’s Rio Grande Oxbow

Rio Grande Oxbow and the city of Albuquerque, looking SE

Rio Grande Oxbow, 2020-04-09, by John Fleck

I was talking last week with one of my collaborators about the challenge of working. All the things that so fully occupied my time and brain seem so inconsequential right now.

I envy friends filling the quiet with productive work.
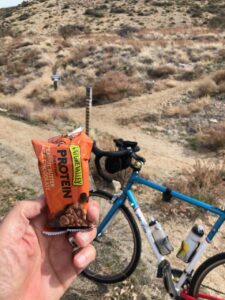
Me? I ride my bike.

In the Time Before (was it just two months ago?) my UNM friend and colleague Becky Bixby and I delightedly tromped around Albuquerque’s Rio Grande with Mary Harner, a faculty member at the University of Nebraska who’s leading a fabulously eclectic study of the Rio Grande and some other rivers.

I first met Mary 15 or 20 years ago, when she was a PhD student at the University of New Mexico doing Rio Grande bosque ecology. She’d done some neat work back then using repeat aerial imagery to look at how the river system had changed. The new work is in some sense a return to that.

Mary and her Nebraska collaborator Emma Brinley Buckley have been in and out of Albuquerque for several years studying our Rio Grande with fresh eyes. Combining science with digital storytelling, they’ve been trying to make sense of the changes our river has undergone over the last century.

On their last few visits, they’ve been zeroing in on the stretch of river through the heart of Albuquerque, collecting old aerial maps and photographs. Emma’s done some nice repeat photography (see example here), and we spent a fruitful day in January poring over orthorectified aerial images over time.

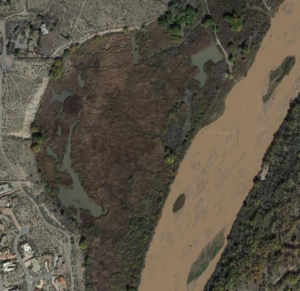
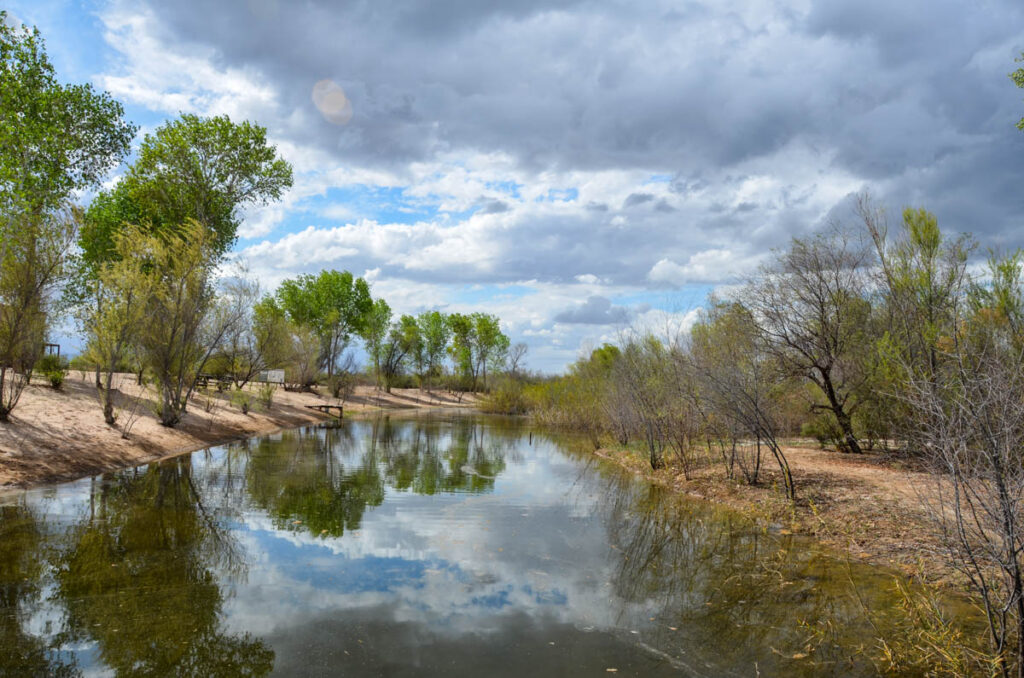
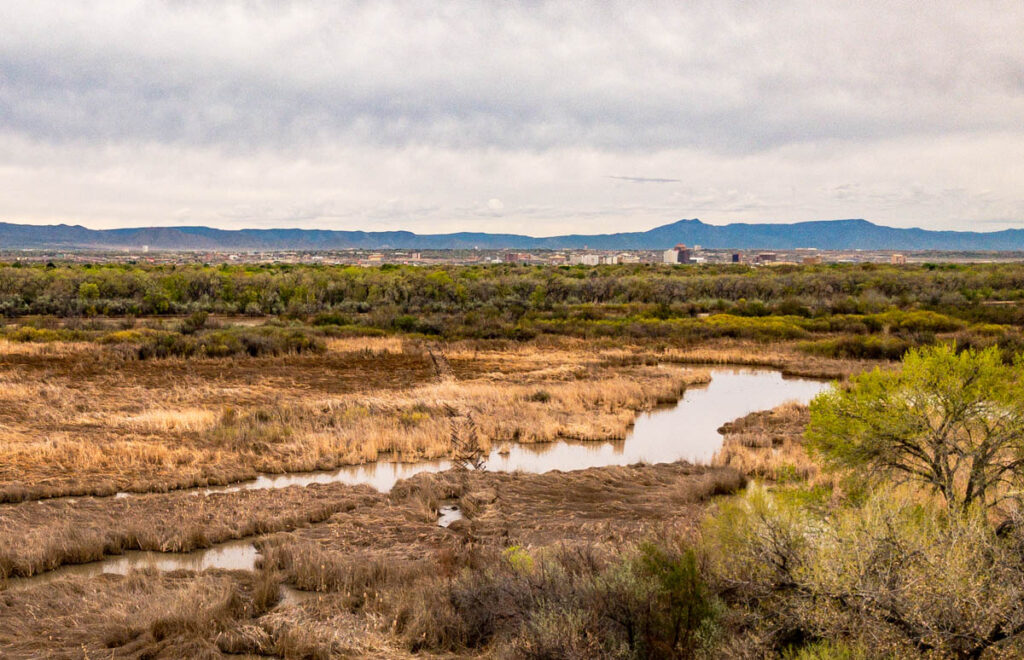
the Rio Grande “oxbow”

One in particular drew our attention – an area along the west side of the river for which Mary and her colleagues had found two images taken in 1959, one in the early spring and one in fall. It included a place we call “the oxbow” – an old cutoff meander at the base of a long, steep bluff along the river’s western margin.

In Life on the Mississippi, one of my pandemic reading diversions, Mark Twain offered a marvelous explanation of how such cutoffs form when a river decides to straighten out a sinuous bend – “the water cleaves the banks away like a knife”.

“There is something fascinating about science,” Twain wrote. “One gets such wholesome returns of conjecture out of such a trifling investment of fact.” So have Mary, Becky, and I been reaping returns on the facts of Mary’s aerial photos. In 1959 it seems not to have been a river straightening a sinuous bend, but rather humans directing heavy equipment to straighten the Rio Grande here, to more efficiently deliver water downstream during drought. You can see the cutoff happen in the before and after 1959 pictures.

Those of us who work and play on and around Albuquerque’s Rio Grande have long wrestled with this central fact – a river that once meandered a flood plain, straightened and channelized in the 1950s, turning it from river into water delivery ditch. Mary’s aerial photos electrified me when I first saw them, a snapshot in time capturing that central fact.

If you look closely at my picture at the top of the post, you can see a line of “jetty jacks”, metal structures installed that summer of 1959 to help stabilize the river’s flood plain. They show up in the second of Mary’s 1959 images, and they remain today. The oxbow itself also remains, the only sizable swampy bit along this stretch of river.

Neighborhoods have encroached on the bluff above it, save one piece of protected city open space park and one undeveloped parcel that is the subject of intense politics right now. Well, which was the subject of intense politics in the Time Before. Hard to know what new home development looks like in the Time After, if there is such a thing.

As I said at the outset, I’ve not been able to focus on the deep work that used to so fill my mind. We’re keeping the UNM Water Resources Program’s trains running, and I’m struggling mightily to figure out how to teach students who I can talk to face to face. But that’s about all the brain share I have right now.

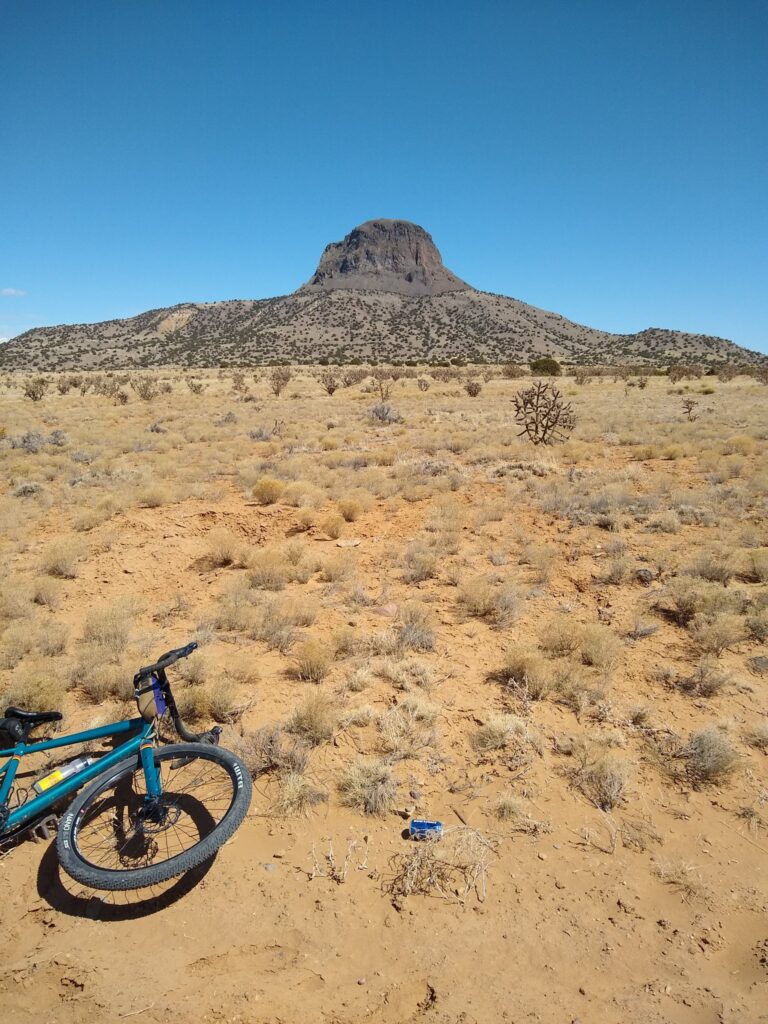
So I ride my bike, to the bluff above the oxbow, and take pictures for Mary and Emma, who can’t be here.

Bud Light empties in the time of pandemic

Cabezon Peak, a bike, and a Bud Light can. Photo by Kevin Carns

My friend and former student Kevin Carns is a truly gifted Bud Light can photographer. Cabezon Peak, the bike, the can – a compositional masterpiece.

Some years ago when we were out riding, my friend Scot pointed out that the empties we saw a long the roadside were almost invariably Bud Lights. So we began documenting them. The resulting Twitter photo essay is but a sampling. If we stopped to photograph every single one, we’d rarely get past the first few miles of a ride.

While it has been suggested that it would be a service to pick them up after photographing, that would conflict with the prime directive of Bud Light can photography – do not touch the Bud Light can. Plus how would I carry them? I’m on a bike!

Over time, friends have begun sharing their own Bud Light cans, which I’ve happily added to the growing Twitter thread. We’ve seen them from as far away as Jeff Kightlinger’s entry from Oxford, Mississippi.

Cabezon Peak is a landmark here, an old volcanic neck out along the Rio Puerco west of Albuquerque, so largely statuesque that you can see if from many miles away if the angle’s right. Kevin seemed surprised when I suggested the above was my favorite of the genre –  “any semblance of masterpiece is by pure accident, it was the end of a long ride and I snapped a quick pic.”

The humility of a truly gifted Bud Light can photographer.

Water flowing in the Colorado River Delta

water flowing at Laguna Grande, March 2 2020

UNM Water Resources Program student Annalise Porter tipped me off to this, from Audubon’s Jennifer Pitt:


Jennifer took the picture in early March at the Laguna Grande restoration site along the Colorado River in Mexico after a pouring rain. With a crazy wet March down there, water’s been flowing off of the normally arid landscape into the old river channel, which is dry mostly all the time. This isn’t a managed environmental flow release along the lines of what we saw in spring 2014 – it just rained!

Working with University of New Mexico Water Resources Program students this spring modeling the Lower Colorado, we’ve been watching the impact of the wet weather north of the border. Blythe, for example, had its second wettest March in records going back 70 years – here’s an updated version of the graph we “discussed” in class this week:

Blythe’s wet March 2020

As a result the Palo Verde Irrigation District, for example only diverted 38,000 acre feet of water from the Colorado in March, a bit more than half of what it took in March a year ago. Imperial Irrigation District’s March diversions this year were about two-thirds of what it took last year.

Buried in the Bureau of Reclamation data on flows in this stretch of the river is a remarkable amount of runoff from wetted lands into the river, which is what Jennifer said is happening in Mexico. When it rains, ag water demand goes down, environmental flows go up. As Jennifer said, in the midst of the bleak and uncertain, this is a nice thing to see.

I Miss My Students

When I emerged from my office at home after recording my first university lecture of the pandemic era, Lissa told me I’d been using my radio voice.

As a young journalist – before newspapers, before books, before my crazy new career as a university professor – I did radio. It’s been nearly forty years, but even now when I slip into a public communication mode, I drop into what Lissa calls my “radio voice”. So without thinking, sitting at a computer in my home office talking to students disembodied in both time and space, I went there.

So OK, I guess that’s the way I’ll have to think of this task. I’m doing radio.

But I still hate it.

I am super sad.

I miss my students.

tacos in the time of pandemic

Westward Ho

In retrospect, the red taco truck represents the moment it all changed.

a red taco truck

Taco truck, Albuquerque, New Mexico, March 2020

It was parked along Central, old Route 66, on Albuquerque’s west side. My friend Scot and I, out for our Sunday bike ride, had been debating the wisdom of our usual bike ride brunch – tacos from one of our local market food counters.

We discussed best risk reduction practices. Maybe one of us should go in and get the tacos, to eat outside? Maybe we should skip the tacos entirely?

From the vantage point of our world circa March 15, 2020, skipping tacos was inconceivable.

And then, like an apparition, the fire engine red La Pichorrita appeared by the side of the road, a clump of cars pulled over helter skelter around it.

Our Sunday ride is always the high point of my week – hours of often aimless rambling, both in route, and conversation. There is time to double back to be sure we’ve covered everything – again, both in route, and conversation. On this particular Sunday it seemed desperately important to engage in idle conversation and idle wandering.

a poor substitute for tacos

This stretch of West Central is not exactly scenic in conventional terms – old Route 66 motels (the “French Quarter” across the street from where we got our tacos, and the wonderfully named “Westward Ho” just down the way). But it’s Albuquerque in a way that we love.

Our discussion after pulling over to the taco truck seems, from today’s vantage point, a vast ten days later, quaint. One of us would order, while the other stayed back, away from the other people also waiting for their tacos. All stood awkwardly, or waited in their cars, as the first responders of barbacoa made our brunch. We took our tacos and sat on a concrete curb in front of a Penske truck rental place. They were delicious.

The ride that day went on forever, down South Valley ditchbanks until we could ride south no more. We didn’t want to turn around.

I’m still riding every day. It remains a mental health anchor. But that was the last ride with Scot for a while, and the last ride with tacos.

On my desperate trip to the supermarket to stock up (we all did that in those early days, didn’t we?) I stood impatiently in the breakfast bar aisle, hurriedly looking at labels to see which bars could serve as a pocketable caloric substitute for tacos.

I am now the owner of several months’ supply of peanut butter and dark chocolate chewy protein bars. They’ll do, but I refuse to learn to enjoy them.


Stream gaging in the time of pandemic, Episode II

From the comments, DG elaborates on the task of stream gaging

And I can see our intrepid hydrotech out on a walkway at the ‘gage’ (thanks for that), laptop in hand. He’s cabled up to a Data Logger dumping the collected data that had accumulated since his last visit to the site some 4 to 6 weeks ago. He also checks the calibration of a Shaft Encoder a Pressure Probe or Bubbler. Any of these sensing elements needing some form of recalibration (they all drift to some degree). It’s windy and cold on the walkway but that doesn’t hinder our technician. As the log dumps into the laptop, he checks the site battery and the solar panel for the ever present bird droppings that accumulate on such an appealing perch. He mutters to himself that he’s sure glad that the avian flu is not his enemy this time around. Oh my? What is this? The mice have gotten back inside of the gage and have left their calling cards behind. The Gager rememberers a few years back about warnings of the Plague and the mice. Every Field Tech in the Southwest had heard about that and kept mice out of their beloved gages. He quickly gets a mask on, sprays over the soiled area and cleans the area to where it’s cleaner than an operating room. The mask, his gloves and soiled towels sealed tightly in a plastic bag.

Of course he muses to himself that working alone at this remote gage is the ideal example of Social Distancing. Nobody comes out to the gage on a cold and windy day. He would be in more peril back in the office next to hydrotech Johnson who is currently wheezing away…

How Dry was 2000-2018 on the Colorado Compared to “Normal”?

By Eric Kuhn

The Colorado River’s natural flows are shrinking by 9% per degree C (1.8 F) of warming as climate change continues to sap the river’s flow, according to an important new study by Chris Milly and Krista Dunne of the US Geological Survey. Milly and Dunne also conclude that increasing precipitation is unlikely to offset this temperature induced drying. The study adds important additional evidence that not only will climate change reduce the river’s flows in the future, but that it is already happening – the already over-tapped Colorado River is facing a future with even less water.

tree ring reconstruction of the Colorado River’s flow, from Woodhouse, Connie A., Stephen T. Gray, and David M. Meko. “Updated streamflow reconstructions for the Upper Colorado River basin.” Water Resources Research 42.5 (2006).

My one caution is that like almost all other similar studies, for baseline purposes, Milly and Dunne use the Colorado River Natural Flow Data Base (NFDB) for the annual natural flows at Lee Ferry.  The Natural Flow Data Base is maintained by Bureau of Reclamation scientists based at CADSWES in Boulder, Colorado. The data base shows monthly and annual natural flows at critical points in the basin including Lees Ferry. It is updated approximately annually when the most recent year for which data are available is added.  The most recent version was released in February 2020 and covers water years 1906-1918.  The version used by Milly and Dunne was released in March 2019 covering 1906-2017.

While the Natural Flow Data Base provided an important source of baseline information for Milly and Dunne, as well as other recent studies of the impact of climate change on the Colorado River, it is important to be aware of its shortcomings.

Uncertainty about early data

The farther we go back in time, the less confidence we should have in the data.  Natural flows are gauged flows adjusted for upstream human hydrologic modifications. Before 1930 there were relatively few gauging stations in the entire basin and before June 1921 there was no gauge at the critical Lees Ferry location (Water Year 1922 is the first full year of measured flows at Lees Ferry). The major sources of consumptive use above Lees Ferry are irrigated agriculture (well over 90% of the use before the major dams and export projects were built beginning in the 1950s). Irrigation uses are the most critical variables used to calculate the natural flows reported in the NFDB, but before the late 1940s the data available on acres under irrigation and cropping types were very sparse. The major source of data was the federal irrigation census conducted every five to ten years. Beginning in the late 1940s, project planning efforts by the Bureau of Reclamation led to much more and better data on irrigation use.

Start date

Although the NFDB begins with Water Year 1906, both the Bureau of Reclamation and USGS published data sets with estimated annual natural flows at Lees Ferry starting well before 1906. In Science Be Dammed John Fleck and I make the case that 1906 was likely picked in the 1960s by Commissioner Floyd Dominy to give the Central Arizona Project the best water yield (read the book). It is a decision we live with today. Before the 1960s, Reclamation studies routinely used natural flows back into the 1890s. There are annual natural flow estimates for Lee Ferry of comparable quality to the pre-Lees Ferry gauge estimates that go back to about 1878.  Why is this important? The early 20th Century pluvial began in 1905/06 and lasted through about 1930. In the three decades before 1905 conditions in the Colorado River basin were much drier, similar to the Colorado River Basin in the 1930s to 50s (thus Dominy’s marketing decision). The choice one makes about which period of record to use makes a difference in how the river’s estimated mean annual flow:

  • 1906-2018: 14.8 million acre-feet per year (MAF/yr).
  • 1878-2018: 14.4 MAF/yr.

Based on tree-ring based reconstructions we now understand that the 1906-30 pluvial was not only wet, it was extraordinarily wet. In an observation first made by Charles Stockton and Gordon Jacoby in their seminal 1976 paper reconstructing Lee Ferry Flows back over 400 years, they conclude that the periods of record used by the Bureau of Reclamation that include the 1906-30 pluvial will be skewed to the wet-side. Based on more recent reconstructions, we now believe that 1906-30 was one of the two or three wettest 25-year periods in the last 1400 years (perhaps even the wettest). The long-term average natural flow at Lees Ferry from the most recent reconstructions (Treeflow.info 2018) is about 14.3 MAF/yr.

Implications of the data’s shortcomings

What are the implications of the cautions I’ve listed?  For starters, when comparing the recent 2000-2018 “drought” period with periods of record that begin with or include major portions of the 1906-30 pluvial, the magnitude of the current “drought” is often overstated.

Based on the NFDB, the mean annual natural flow at Lees Ferry for 2000-2018 was 12.47 MAF/yr, 15.5% less than the 1906-2018 average of 14.76 MAF/yr (“normal”).  However, using a different baseline such as the post-pluvial period of 1931 -2018, that same drought period is only 10% less than “normal”. Given the uncertainties in the natural flow data base before 1930, the use 1931-2018 is a reasonable decision (and one that is gaining favor with some of the basin’s water agencies).

For research purposes, study authors might want to give more consideration to the uncertainties in the NFDB. They should consider using a periods of record starting in 1922, after there was an actual gauge at Lees Ferry, or 1931, the post pluvial period and the year after the Boulder Canyon Project Act funded additional gauging stations, or even 1948, the year soil scientists, Blaney and Criddle, were tasked with improving our understanding of irrigation consumptive uses in the Upper Basin. If possible, study authors may even want to compare their results with the long-term paleo record mean of 14.3 MAF/yr. All are reasonable approaches that will yield slightly different results.  As with Milly and Dunne, for many studies, the period of record used may be driven by other data limitations.

The bottom line is that there are a range of different answers to the question of what is the normal flow of the Colorado River at Lees Ferry. Milly and Dunne, along with other researchers have used the Natural Flow Data Base to help us understand the impact of climate change on the Colorado River, have made critical contributions. But as we move forward with our policy responses, we need to be open about the uncertainties inherent in the data we are using. An effort to study the sensitivity of climate change analyses to the uncertainties in the NFDB would be a valuable addition to our understanding.