New Mexico’s Rio Grande, bailed out by an impressive monsoon

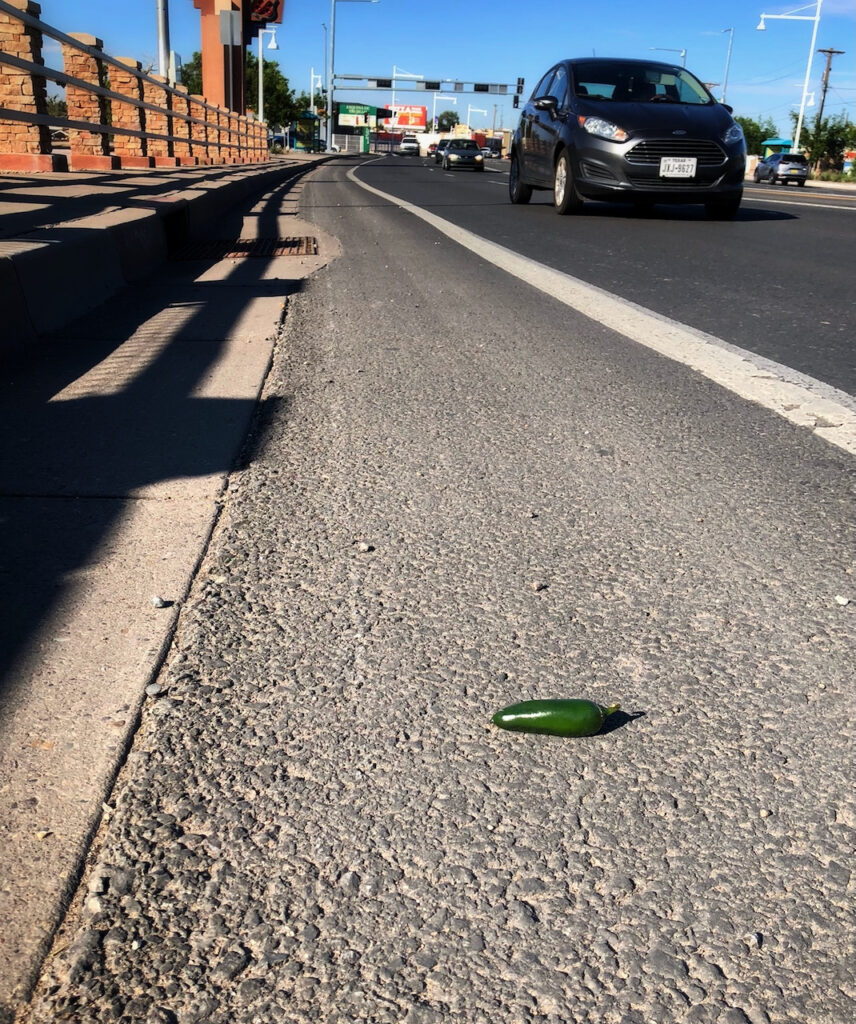
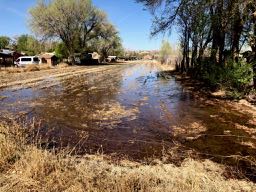
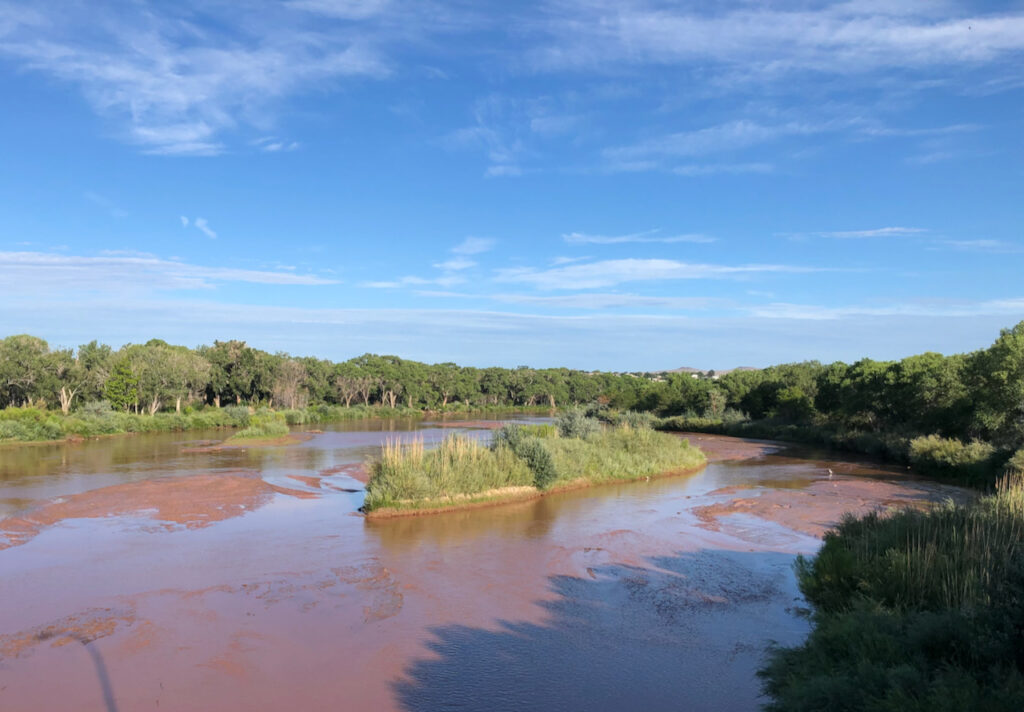
Rio Grande at Albuquerque’s Central Avenue Bridge, 8 a.m. July 28, 2021

A robust July monsoon has allayed our worst fears about central New Mexico’s Rio Grande.

Is it really a “monsoon”?

Back in the days when my paid gig was writing newspaper stories, I loved writing about the monsoon, and every time I did I would get helpful feedback from readers anxious to explain that I was a doofus and didn’t know what I was talking about, a monsoon, no way!

While they may have been right about the doofus part, with respect to the monsoon part, yes way.

Here’s Ben Cook and Richard Seager by way of explanation:

The North American Monsoon (NAM) may be a poor relation of the majestic Asian monsoon but is nonetheless a real monsoon that provides important rainfall to Central America, Mexico and the interior parts of the southwestern U.S. (primarily Arizona and New Mexico). In Mexico and Central America the NAM is critical for water supply and agriculture since winter precipitation in these regions is so small. In the southwest U.S. winter precipitation, arriving at a time of low evapotranspiration, is critical to water supply but the NAM precipitation remains important for soil and groundwater recharge, ecosystems, rainfed and rangeland farming and for fire.

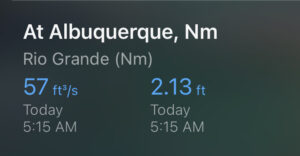
How has this year’s monsoon helped central New Mexico’s Rio Grande?

When last we visited on this topic two weeks ago, I’d just completed a swift bike ride to watch the river dry. Since then, we’ve had two weeks of wet.

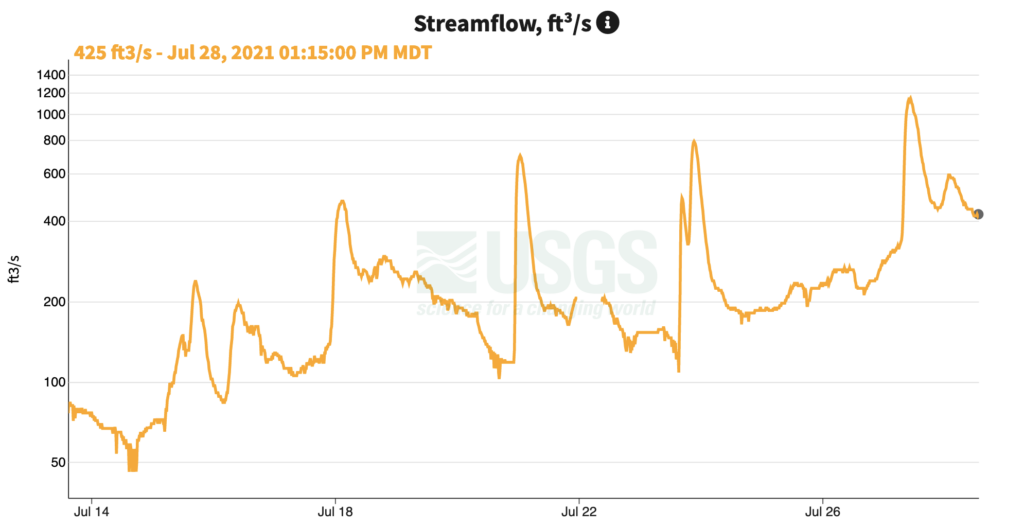
Rio Grande flows since mid-July 2021, via USGS


Each one of those little spikes represents runoff from a rain event somewhere in the watershed between the Central Avenue Bridge in Albuquerque and Cochiti Dam to the north. Our monsoon’s spotty that way – the “official” Albuquerque rain gauge at the airport has recorded just a third of an inch of rain during that time. But every couple of days it’s rained somewhere in the watershed feeding the river – sometimes a lot.

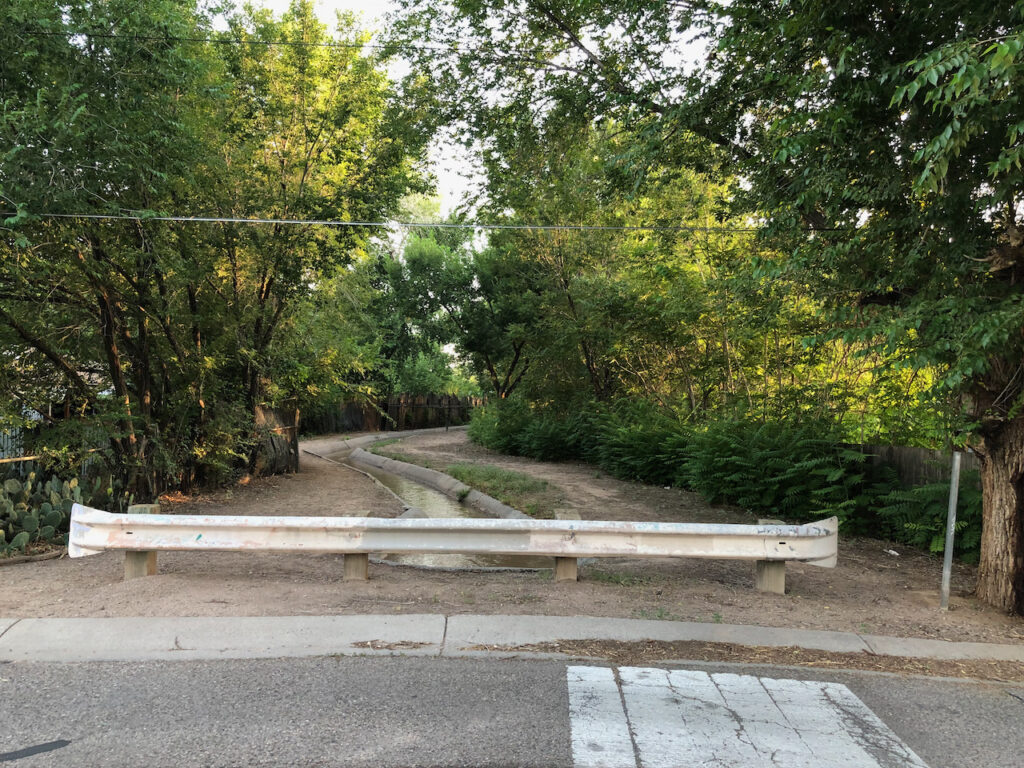
(It has been accompanied by tragedy. People with no home of their own often take up residence in Albuquerque’s flood control system. Three people died last week in one flash flood – see Elise Kaplan’s thoughtful effort to memorialize them. Our flood control infrastructure is great at protecting our city, but it has this dark side.)

The latest I have heard in conversation with water management folks is that the rains may have bailed us out of the river drying in the Albuquerque reach – we’re at this point unlikely to be writing about “the first time the Rio Grande has dried through Albuquerque since 1983”, which many of us have been doing.

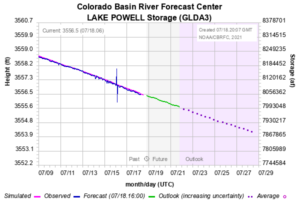
But what about Elephant Butte?

The good news is that a lot of this monsoon water – flowing past Albuquerque and contributed by arroyos downstream – is making it to Elephant Butte Reservoir, which provides storage for downstream users in southern New Mexico, Texas, and Mexico.

The bad news is that Elephant Butte is really, really big, and really, really empty, and the monsoon inflows are tiny compared with what we need, which is a big winter->spring snowmelt.

A month ago, modelers at the U.S. Bureau of Reclamation were projecting Elephant Butte would bottom out at about 10,000 acre feet of storage in early August. It’s a 2 million acre foot reservoir. That’s just a half a percent full. That would have been the lowest since August 1954.

Updated model runs, incorporating the burst of monsoon moisture, now suggest Elephant Butte will bottom out at around 60,000 acre feet of storage sometime in the first part of August. That’s still just a hair above 1 3 percent full, which illustrates a central feature of the monsoon’s role in Rio Grande water supply: Compared to winter snowpack, monsoon rains’ contributions are tiny, only playing a minor role.

But coming at the right time, they nevertheless matter.

(Huge thanks to Carolyn Donnelly and Mary Carlson at the Bureau of Reclamation for modeling run data and helpful explanations. Tons of data in the  right hand rail here.)

Most Albuquerque: Green Chile in the Bike Lane

Green chile in the eastbound bike lane, Route 66 bridge over the Rio Grande, Albuquerque, New Mexico, July 28, 2021

A most Albuquerque summer morning for a bike ride:

  • Muggy monsoon dewpoint
  • Muddy storm-fed Rio Grande
  • The smell of green chiles roasting, early, in the El Super parking lot
  • This lone green chile in the eastbound bike lane over the Rio Grande

Is the Colorado River “Stress Test” stressful enough?

By Brad Udall and John Fleck

Earlier this year, we argued in a Science magazine editorial that Colorado River forecasting must take the growing risk of climate change seriously. The latest five-year projections from the U.S. Bureau of Reclamation offer a practical example of the challenge.

Published July 8 (see here and here) with an accompanying news release, the projections suggested that if the trends of the last 30-plus years continues, there is a 79 percent chance that Lake Powell could drop next year below elevation 3,525 – a danger zone for managing power production and releases to the Lower Basin going forward. With the reservoirs behind Hoover and Glen Canyon dams expected to drop below 30% by early 2022, these projections take on a new importance — we no longer have a huge water buffer to protect us from future low flow years.

It is stark news. But perhaps not stark enough.

This forecast takes advantage of an important new tool Reclamation has invested in called the “Stress Test” to give us a sense of the future risks we face.

The Stress test goes beyond the old “the future will be like the past” scenario building we have used in the past on the Colorado River. This new tool takes an important step toward incorporating climate change. But we are concerned that it doesn’t go far enough.

The five-year projections come in two flavors. One, “the future will be like the past,” uses the historical hydrology since 1906 with a mean flow of 14.8 maf. In a stationary climate, this hydrology would be fine. But the climate is not stationary, and the only real use for this hydrology is to see just what we’ve lost as climate change saps the river, not what the future might hold.

The alternative ‘Stress Test’ hydrology uses the period from 1988 to 2019 with an annual flow of 13.3 maf. While more reflective of current conditions than the full hydrology, these flows also do not reflect the past 22 years with its annual runoff of 12.4 maf.  When river managers first began using it, the “Stress Test” marked an important step toward taking climate change seriously. But these flows are no longer what they purport to be.

What we really need, and what we argued for in our Science editorial, is a ‘reasonable worst case future’.  This is the future that a prudent person would plan against, knowing what we currently know.

The last 22 years are the best analog for our 5-year future.  And within those 22 years one period stands out as the worst, the period from 2000-2004.  These years averaged 9.4 maf, and during that time Powell and Mead lost ~25 maf.   This period is what a prudent person would pick as a reasonable worst case — it happened before and it can happen again. In fact, the extreme dry of 2020 and 2021 suggests it may be happening now.

It would be interesting to see how Reclamation’s model performs against 2000-2004 and also against 2000-2021.

Within the Colorado River management community, there are questions about these modeling exercises on the demand side as well. Are water uses across the basin overstated? Might that at least partially offset overly optimistic supply estimates?

Pat Mulroy, after being burned by false probabilities, famously said that as a water manager she was only interested in possibilities, not probabilities.  The hydrology from 2000-2004 is a possibility. Let’s learn the lessons it holds.


Walking and chewing gum: mixing crisis narratives and messages of optimism

Not gonna lie – watching Colorado River reservoirs decline so precipitously has been painful.

But it is important to cultivate optimism, and there is, in fact, reason to be hopeful about our ability to deal with the challenges. That’s the message the University of Arizona’s Bonnie Colby and I shared in a recent conversation with Sarah Bardeen at the Public Policy Institute of California:

Bonnie Colby: Everybody knows we’re moving into a serious situation. State and federal officials have been tracking reservoirs and groundwater levels, and tribal nations are involved in a way that they never have been before. That’s much needed, from a social justice perspective, and because they’re holders of the most senior rights in the system. In Southern California, 20 years ago, all the water users were much more likely to lean on their legal entitlements and litigation. We see much more flexibility nowadays—there’s been big progress.

Not just Mead: Powell will soon drop to the lowest level since filling in the 1960s

Lake Powell heads for record low. Source: CBRFC

While the historic June 15 low for Lake Mead has drawn headlines – “its lowest level on record since the reservoir was filled in the 1930” – we’re about to hit a similar milestone upstream at Lake Powell that has received less attention, but may in fact be more important.

It was co-author Eric Kuhn who drew this to my attention – I hadn’t noticed. He notes that sometime around July 24 give or take our eyeballing of the Colorado Basin River Forecasting Center graph, Powell will cross elevation 3,555 feet above sea level. That was the previous post-filling low, on April 8, 2005. From there, you have to go all the way back to the summer of 1969, when Powell was first being filled, for the “last time Powell’s been this low” references.

I say “may be more important” because relative to Mead, Powell is where the Colorado River Basin’s chaos and uncertainty are most clear.

Users who get their water from Mead have a huge reservoir with a predictable inflow above it – the Upper Basin’s releases from Lake Powell. That means if you’re a water manager in Los Angeles or Phoenix or Las Vegas or Imperial, you have a clear picture of what to expect over the next several years. The expectations may be for a reduced supply, but you can operate with pretty clear expectations about what the reductions will look like, and least for the next few years.

Powell is where the real trouble shows up first. 3,555 is a loud and discomforting noise.

A River No More?

Dawn on a dwindling Rio Grande. Albuquerque, New Mexico, July 14, 2021

Between the wildfire smoke and two important meetings for which I am unprepared, I intended to stick to a quick indoor Zwift bike ride this morning before getting on with my day. Until I checked the gauges.

Measuring a shrinking river

57 cubic feet per second.

It’s a morning ritual, the little iPhone app while I’m curled up in my comfy chair with a bowl of Grape Nuts and the first cup of coffee.

57 cfs at Albuquerque’s Central Avenue Bridge is something entirely new to me in my 30-plus year relationship with the Rio Grande. 100 cfs used to be my mental milestone for “going dry”, and in my years of watching the river it’s rarely gone there, and never this early in the summer.

It was still dark, but I’d plugged in my bike lights to recharge last night, so I threw on bike shorts and a shirt, filled a water bottle, and tore down to the river.

I rode fast to try to catch the morning light. (I am old, but it is mostly downhill.)

The shortest route from my house to the river crosses the old abandoned Albuquerque Acequia, which used to irrigate fields north and east of Old Town back as far as the 1700s. Farther west the Alameda Drain, another canal that’s part groundwater drainage, part water supply for folks to the south, was still running.

57 cfs at the Central Avenue Bridge didn’t look much different than 76 cfs last Sunday. You can see the old bridge pilings on the west bank, poking up like sentinels of climate change.

Rio Grande at Central Avenue, Albuquerque, looking west. 57 cfs. July 14, 2021

Around the river’s west side, the Middle Rio Grande Conservancy District is still diverting water through the Atrisco Siphon into the Arenal Main. The gauge readings are down this morning, so I don’t know the number, but I’m guessing more water coming through the siphon than down the river’s main channel.

The egrets hanging out looking for breakfast had chosen canal over river.

The latest note from the river managers this morning suggests the river’s still continuous through the Albuquerque reach, but barely. It’s thinning down near the Albuquerque sewage treatment plant outfall, but doesn’t appear to have broken yet. Dewpoints are high this morning. Maybe it will rain.

On the way home, I swung north through the Duranes neighborhood to check out the Duranes Ditch. It’s one of the old ones, and per a friend in the neighborhood it had nearly gone dry yesterday, but it was running again today at what the gauges suggest is maybe 12 cfs. Such a tiny number, but looming larger right now.

The Duranes, twisty across the valley floor, has been in its present location long enough that its role on our landscape is as much neighborhood creek as it is irrigation canal. We have replaced the natural flood plain with a distributional system that has created a novel ecosystem, rich and diverse and culturally complex, as it spreads across the valley floor, twining through neighborhoods of old farms and newer subdivisions, tree-lined and rich.

I’m not sure if I’ll be sadder when the Duranes and Griegos, my other favorite ditch, go dry, or if I’ll be sadder when the river goes dry.

It’s all just sad.

Duranes Ditch, Duranes, NM (OK, technically Albuquerque?), July 14, 2021. Maybe 12cfs?


Brad Udall: Second-worst Powell inflows in more than half a century

Brad Udall on twitter yesterday ran through a striking series of graphs of the current state of the Colorado River. With his permission, I’m posting them here along with a slightly polished version of his accompanying commentary. Some key points that grabbed my attention:

  • Second-lowest Powell inflow in a period of record we use dating to 1964.
  • Risk of Powell dropping next year to levels that could jeopardize power production
  • Risk of Mead dropping low enough in the next 18 months to trigger much deeper “Tier 2” reductions to Lower Basin water users in 2023.

By Brad Udall

Reclamation’s ‘unregulated inflows’ into Lake Powell show that 2021 will be the 2nd worst year after only 2002 going back to 1964. 2021 will be the RED bar most likely. This is a really grim year for runoff.

Lake Powell inflows

2021 inflow will be only ~3 maf, compared to the 1981-2010 average of 10.3 maf or the 2000-2021 average of 8.3 maf (20% less than 1981-2010 average).(maf = million acrefeet)

Considering that Powell will release or lose to evaporation ~ 8.5 maf, the lake will lose ~ 5 maf this year or ~55 feet of elevation.

April 2021 snowpack above Powell peaked at ~85% of normal but will generate about 25% of normal river flow. This comes on top of April 2020 snowpack of 100% of normal that generated about 50% of normal flow.

Declining runoff efficiency has been noted in multiple peer-reviewed studies. For a recent overview of recent climate change studies on the Colorado River see this written with Jonathan Overpeck:

Multiple studies since 2016 have now found human fingerprints on the nearly 20% loss in flow since 2000 and attribute up to half of that loss to the approximately 1.2°C or more warming that has occurred during the last century.

Jeff Lukas points out that the twitter thread implied that the low runoff efficiency this year as measured by runoff as a percent of snowpack is all due directly  to warming. I did not mean to imply that. The low runoff percent numbers are much more a function of (1) very low spring precipitation in both 2020 and 2021 and to a lesser extent (2) low soil moisture from the previous year.  It may be that there is a human-caused connection to the low spring precipitation although there’s no real evidence of this yet.  Low soil moisture in the springs of 2020 and 2021 is definitely connected to dry and very warm late summer and early fall from the previous years.  Teasing this apart to obtain the actual driver(s) is not simple. That said, no one should doubt that climate change is reducing the flows of the Colorado. Multiple peer-reviewed papers have now supported this finding.

More from Jeff on this here.

Here’s what’s going to happen to the nation’s 2 largest reservoirs because of this measly inflow:

Losses to Mead and Powell

Note that combined contents will drop below 30% by late next year.

Here’s that decline for all years back to 1935 when Mead first filled. These two reservoirs will hold less water than Mead did alone in many years before 1964 when Powell was built.

Combined storage, Mead and Powell

By next April Powell will hit 5.4 maf, ~185 feet below full. See Red dots. This will be the lowest since its initial fill in 1964. Since 1999, Powell will have lost ~18 maf, 75% of its contents.

At 5.4 maf Powell could be low enough to lose the ability to generate power. (We’re uncertain about how penstocks operate when lake gets low — water in penstocks can not be aerated or turbine damage will occur.)

Loss of power, while not calamitous, is concerning. Power revenues fund environmental compliance and other important items in the basin.

As part of the 2019 agreement, the UB can release flows from reservoirs upstream of Powell to prop it up. But there is only about 5 maf for that all together. It is a one-shot deal.

We’ll have to wait on next winter to understand what happens after April of 2022. But 5.4 maf is very little water in a 25 maf reservoir.

So what about Lake Mead, the nation’s largest reservoir?

Reclamation’s current forecasts show January 1, 2022 elevation at 1065’ feet (8.8 maf) , well below the 1075’ needed to avoid a ‘Tier 1 Shortage’.

Decline of Lake Mead

If it ends up below 1050’ on Jan 1 (as projected in August 2022), that will lead to a Tier 2 Shortage (total cutbacks of 721 kaf). Otherwise, Mead will face a 2nd year of Tier 1 shortages. Either way, this is not good.

Planning for bad news

Thanks to Megan Kamerick and KUNM, our New Mexico public radio juggernaut, for offering the platform and leverage to help boost our message about climate change response on the Colorado River:

[N]obody’s going to sort of voluntarily raise their hand and say, ‘Yeah, we’re happy to have less.’ And so negotiating those agreements where everybody agrees to live with less and agrees on a set of numbers, or what that might look like, is really going to be the hard part. Because I’m really confident that, you know, once we come to agreement on what the allocations are going to be, we’ll learn to live with them.

We’re really adaptable.

Here’s the Fleck/Udall editorial in Science magazine that triggered Megan’s piece.

Bernalillo County Agriculture, a Very Brief History

US Census, USDA Census of Agriculture

Holed up in a UNM Water Resources Program conference room, my book co-author Bob Berrens and I spent an afternoon last week trying to make sense of the graph above.

The 1920 U.S. Census description of the greater Albuquerque area (Bernalillo County) captures a remarkable moment in our city’s history. We were a community of ~30,000 people, surrounded by ~30,000 acres of farmland.

There were 10,205 acres of apple orchards, 6,482 acres of peaches. We grew pears, plums, cherries – each at over 1,000 acres. Farming spread up and down central New Mexico’s Rio Grande valley, but what the economists of the day described as “specialized farms” – fruits, vegetables, poultry, and dairy – were all clustered a quick farm truck’s drive (or wagon?) from the city.

Farther up and down the valley were found what those same economists of the day described as “general farms”, which we take to mean not marketing much directly in the city, basically either subsistence farming or failed/failing development schemes.

Bernalillo County irrigated agriculture, circa 2021

A  series of economic studies from that time period, a rich lode of data we’re mining, suggest farms here didn’t do much in the way of export beyond the local markets.

There’s an early thinker (economist?) one quotes at this point in such discussions named Johann Heinrich von Thünen. In his 1826 book Isolated State, von Thünen basically argued that the land closest to a city would be the most valuable for producing the stuff people needed in the city, so there would be these rings radiating – fruit, vegetables, poultry, and dairy, for example:

Delicate horticultural products such as cauliflower, strawberries, lettuce, etc., would not survive long journeys by wagon. They can, moreover, be sold only in small quantities, while still quite fresh. All these products will be grown near the Town.

Gardens will therefore immediately occupy the land immediately around the Town.

Von Thünen was writing this before we could schlepp our food longer distances via rail etc., so the model needed a lot of adjustment (needed to be abandoned?) pretty soon after he developed it, but people like us still like to quote it because its simple formulation makes intuitive sense and helps us tell our stories.

So in explaining the graph above, von Thünen is a great starting point. And abandoning von Thünen quickly also has its utility. Here, we think, is the basic narrative structure:

1920

We live in a von Thünen world, with a growing city at its center and farmers clustered around, growing the food. There were 1,200 farms in Bernalillo County in 1920, according to the census.

1920 – 1930

Still a von Thünen world, but as the city grew, two other things were happening that drove down the acreage. First, the valley floor was becoming increasingly swampy as water tables rose because of the lack of drainage in the valley – super common problem in these irrigated places. Second, shipping technology, especially refrigeration, increasingly made imported foods attractive.

1930 – 1945

The creation of the Middle Rio Grande Conservancy District brought the long awaited panacea of drainage to the valley, lowering the water table and, combined with irrigation system “improvements” (much ink will be spilled in the new book to explain the scare quotes), a bunch more land was brought into production.

The available economic data suggests this did not go well for a large proportion of those who attempted it. Again, in the new book, much ink will be spilled.

But through the 1940s, they kept trying. By 1945 the number of farms had risen to 1,795.

1945 – 1960

With a booming post-war economy, the valley floor finally found its successful cash crop, as Bob likes to say – mortgages. As fast as the land could be turned over, farms became suburbs.

By 1960, the number of farms had declined to 495.

1960 – present

We think the graph above begins to lose its utility post-1960, because something else is happening that a simple tally of commercial agricultural irrigation doesn’t capture.

The total number of farms by the mid-1970s had dropped to 234. But then something strange happened which we need to explain. While the irrigated acreage remained flat to declining, the number of farms began to rise. By 2017, it was up to 1,248. Average “farm” size goes down and down and down, number of “farms” goes up. These are not farms in the classic connotation of the word – a piece of land used in a commercially agricultural way.

We are still using water down on the valley floor to, in a sense, irrigate those mortgages. Sometimes called “hobby farms”, perhaps more appropriately “custom and culture” farms, took hold.

Or just plain yards.

Changes in municipal water use under pandemic shutdown – a neat case study

A colleague sent me this neat paper by Nicholas Irwin and colleagues at the University Nevada Las Vegas about how water use patterns shifted under initial COVID lockdowns. As you would expect, home water use went up while institutional use went down. But was it just a one-for-one offset? No…

[W]e find an initial and continuous decline in average daily usage for commercial and school users. In contrast, we find an initial increase in consumption by residential users with this effect increasing over time. Aggregated across all users, the SAH order led to an increase in net water usage between 32 and 59 million gallons over the first 30 days.

Nicholas B. Irwin, Shawn J. McCoy, Ian K. McDonough, Water in the time of corona(virus): The effect of stay-at-home orders on water demand in the desert, Journal of Environmental Economics and Management, Volume 109, 2021