atmospheric river headed California way

I love the way “atmospheric river” has now entered the public weather discussion lexicon:

Enjoy the dry, cool days that mark the start of this week in the Sacramento area. Then get ready for an “atmospheric river” late in the week that will bring perhaps 3 inches of rain to the Valley, the National Weather Service said Sunday.

ARs (they evening have an initialism!) are all the rage in weather and water management circles in the west these days. Some material from the Inkstain back catalog:

More on the definition of “drought”: a dry spot

Another episode in my effort to explore the meaning of “drought” by way of example.
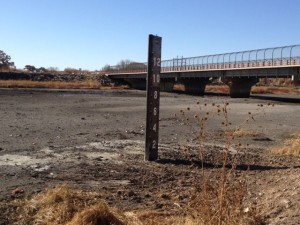
Tramway wetland, November 2012

Tramway wetland, November 2012

Up on Albuquerque’s north side is a spot the birders call the “Tramway wetland”*. It’s the spot where the main flood control channel for much of Albuquerque slows before entering the Rio Grande. The local flood control authority has designed a wide shallows to catch the water and allow grody gunk to settle out, to reduce the amount of urban runoff contamination entering the river. It usually smells bad and looks even worse, but the birds, especially migrating shorebirds, love it because it’s one of the few large areas of shallow water in a stretch of river that once would have had much shallow water, before humans used dams and levees to break it of its meandering ways.

More than once I have taken my sandwich and binoculars to the Tramway wetland, which is not far from my office, at lunch. Smell notwithstanding, the birding is great. I’ve seen 50 species there, and the eBird reports for the site list 191 species.

I was out on Friday looking for a rare dunlin that several birders had spotted, and was amazed at how little water there was in the wetland. Just a few pools in the deepest spots, far less than usual. There are two things likely going on here. The first is “drought” by the conventional definition: not a whole lot of rain. Since Sept. 1, we’ve had just 0.55 inches (1.4 cm) of rain at the rain gauge at the airport. Average for  this stretch is 2.58 inches (6.55 cm). So there’s less rain flowing down the flood control system and out into the wetland.

The second effect is distinctly anthropogenic.

In addition to rain, the flood control system gets some water when Albuquerque’s municipal water agency starts up one of its big groundwater pumps. They flush an initial pulse of water into the flood control system, which makes its way down to the wetland. Albuquerque has shifted some of its demand to surface water, using a dam along the Rio Grande to divert water for municipal use. This seems to mean less pump flushing, and therefore less “wasted” water flowing into the Tramway wetland.

Here, I think, there is drought.

There were still a dozen sandhill cranes, drought or not, poking around in the barely-wetland, plus a great blue heron, some odds and ends of ducks that I really felt sorry for poking around in the mudholes that are left. And maybe the dunlin. Couldn’t be sure as it took flight, so I didn’t add it to my life list.

* The bridge in the picture is actually Fourth Street NW, or maybe Second Street NW (a confusing intersection), which turns into Roy Road, which eventually turns into the road we call Tramway. Don’t ask me why it’s not therefore the “Fourth Street wetland”. I just do as I’m told.

the importance of music education

Once, while a young teen, I spotted a house on fire while dad was driving me home from my bassoon lesson. I alerted the residents, who were unaware that their roof had caught fire. It was a relatively modest fire, and firefighters were able to quickly extinguish it without major damage to the house or injury to those inside.

I consider this a good example of the importance of music education.


Where does this fit into our definition of “drought”?

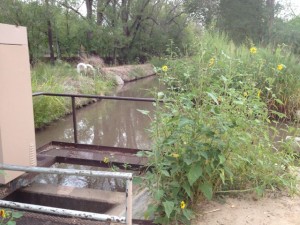
This is August 2012 along the Duranes ditch in Albuquerque’s north valley. The ditch on the left is relatively new. The spur to the right, obscured by the sunflowers, has been in continuous use for more than 300 years. The previous 24 months for this climate division had been the second driest such stretch on record, going back to the 1890s. Yet water management decisions – storage of waster upstream for release during the depth of summer, importation of water via the San Juan-Chama Project from the Colorado River Basin, a distributary network that fans the river out across the Rio Grande Valley floor – made this spot cool and lush in the heat of a droughty summer.

What does this contribute to our understanding of “drought”?

Duranes Ditch, August 2012

Duranes Ditch, August 2012

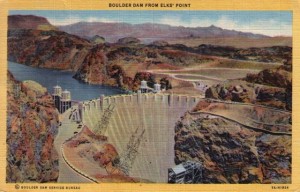
Boulder Dam, circa 1946: “a lot of propoganda for Daddy to read”

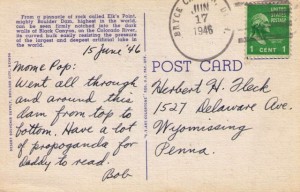
My sister, Lisa, found a box of Dad’s old postcards over the weekend, including a number he had sent during a trip out west in 1946. He’d just gotten out of the Army, a Pennsylvania kid wandering the landscape that would later animate his art and become our home. There was this, to his parents back in Wyomissing, from his tour of Boulder Dam:

Boulder Dam from Elks' Point

Boulder Dam from Elks’ Point

"a lot of propoganda for Daddy to read"

“a lot of propoganda for Daddy to read”


15 June ’46

Mom & Pop:

Went all through and around this dam from top to bottom. Have a lot of propoganda (sic) for Daddy to read.

Bob

measuring drought – the right tool for the job

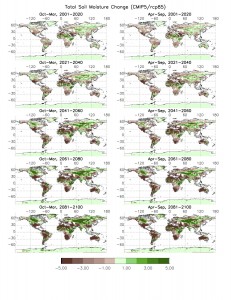
Richard Seager’s widely cited 2007 paper projecting “an Imminent Transition to a More Arid Climate in Southwestern North America”  did not use the Palmer Drought Severity Index. His work relies on a calculation of precipitation minus evaporation (P – E) to determine the extent and trend of drying under a changing climate. In response to my recent inquiries about the flurry of news involving the question of whether the Palmer shows any global drought trend (background here, here, here) Seager emailed this (shared with permission, linkage added by me, with the plot to which he refers below, click to biggen):

PDSI should not be used for future climate change, pure and simple. The Sheffield paper redoes in many ways a 2008 paper by Eleanor Burke (UK Met. Office) that made the same point about the pitfalls of the simple PET calculations in the PDSI calculation. Indeed Chris Milly has recently made the same point. The problem with the Sheffield paper is it then leaves the impression that there is little to worry about. Not so. Here is an unpublished plot of change in soil moisture for summer and winter half years for the CMIP5 ensemble with the rcp85 scenario – I made % change maps for each model and then averaged the %s to make the multimodel ensemble mean. Bottom line – you still see the widespread drying that PDSI trends indicate though a 10% drop in soil moisture is probably less dramatic in appearance than -10 PDSI.

Global Drought Trends

Global Drought Trends, courtesy Richard Seager


stuff I wrote elsewhere: “Depends on what you mean by ‘drought.'”

From the morning paper, an exploration of what we mean by “drought”, with some stuff on the Sheffield Nature paper so talked recently in drought circles, along with the latest grim outlook:

“Drought,” University of Arizona research Gregg Garfin said, “is defined by its impacts.”

I realize this is a long-winded way of being very unhelpful to Ken, whose question started all my inquiries. My simpler answer, Ken is, “Depends on what you mean by ‘drought.’ ”


Stuff I wrote elsewhere: on drought metrics

From the work blog, some material from a discussion among drought researchers on the Sheffield Nature paper and the question of when the Palmer Drought Severity Index is or isn’t the right tool for the drought measurement job. Here’s Dave Gutzler:

Despite its many limitations PDSI is still a meaningful indicator of short term climate variability (interannual, maybe up to decadal, time scales). If you look at the uncertainties described by Sheffield et al., they are on scales of tenths of PDSI units on continental-global scales. Big short term droughts, which are primarily driven by precip anomalies, will be captured by PDSI regardless of the method used to describe evapotranspiration. For that matter, the magnitude of long-term change looking forward, associated with really big century scale temperature change, will show up as ‘long term drought’ regardless of the details of the PDSI calculation. That’s why so many different hydrologic indicators (streamflow, vapor pressure deficit, etc.) that do not incorporate similar debatable ET parameterizations all point in the same direction. And that’s why I don’t think the Sheffield paper should require us to reject the validity of the core conclusions presented in so many recent papers.


Stuff I wrote elsewhere: court rules against New Mexico water transfer

From Saturday’s newspaper, my story about a state court ruling against a proposed groundwater transfer case in New Mexico:

State officials made clear Friday that, while they ruled against this application because of its failure to specify where and how the water would be used, they do not in general oppose water transfers around the state.

Such transfers are frequently mentioned as a way to meet growing needs in the Rio Grande Valley. D.L. Sanders, lead attorney for the Office of State Engineer, encouraged the Augustin Plains Ranch group to file a new application that meets the state’s legal requirements.

“We’re in favor of promoting innovative ideas like this,” Sanders said.


So what exactly do we mean by “drought”?

The Sheffield et al drought paper in Nature that I blogged quickly about a couple of days ago has triggered all kinds of fascinating discussion among folks in the southwestern US “drought community” (yes, there is such a thing). In brief, Sheffield and colleagues argue that a careful application of the Palmer Drought Severity Index suggests that there has not, in fact, been a discernable global increase in drought over the last 60 years.

There’s been some pushback from other researchers who have been using PDSI and coming to a somewhat different conclusion (see Aigua Dai here, for example). This suggests to me that, at the very least, PDSI’s sensitivity to the inputs that lead Dai and Sheffield to such different conclusions should give those of use who have been using it as something of a black box (I’m looking at me) some pause.

But more importantly for my purposes as a communicator, the discussion about the paper has served to reinforce the problem with the word “drought”, which is often used loosely (I’m looking at me) without care to delineate what sort of drought, with what sort of effects, we’re talking about. This recalls a 1985 review by Wilhite and Glantz that found 150 definitions. Here there be communication dragons.

Insofar as “drought” means variance on the dry side from the norm, but the norm in at least one key variable (temperature) is changing, what are we to with the statistics, and also with the word?

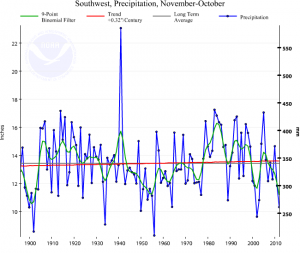
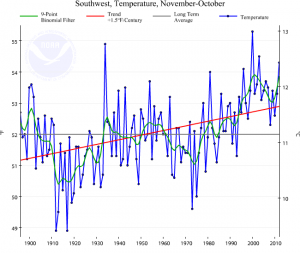
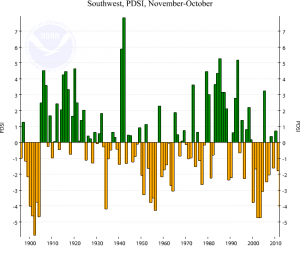
As a conversation starter, here’s some basic data on “drought” for the southwestern United States (Utah, Colorado, Arizona and New Mexico).

Precipitation

Precipitation

Temperature

Temperature

Palmer Drought Severity Index

Numbers represent 12-month averages, ending October (the most recent data). Data courtesy NCDC.