Via Realtor.com, we find this lovely 7,000-square foot home in Boulder City, Nev., with a swimming pool plus a great view of the bathtub ring on a dwindling Lake Mead, where the pool water came from:
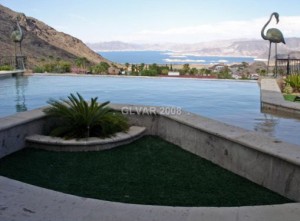
Full pool, empty reservoir
Yours for just $1.9m.

Via Realtor.com, we find this lovely 7,000-square foot home in Boulder City, Nev., with a swimming pool plus a great view of the bathtub ring on a dwindling Lake Mead, where the pool water came from:
Full pool, empty reservoir
Yours for just $1.9m.
My current water policy obsession is the question of what actually happens – agency by agency, water user by user – when the water starts to run out.
Much of the “OMG, we’re running out of water!” discussion plays out in the form of graphs of the future that extend projected supply and demand curves, pointing to the gap, and running around with our hair on fire. But to the extent that the gap between supply and demand equals negative water, we can’t do that, and individuals and institutions will change their behavior in some way, and the question is how. Who will use less and how, or who will run out?
As one watches the Midwest discussion right now, perhaps the “how” involves reframing our basic approach to water:
“Water has been viewed as a basic commodity, a basic right,” said Les Lampe, a water expert with consultancy Black & Veatch. “You turn on the tap and water comes out and you don’t pay very much for it. That has to change.”
I confronted a litany of drought when I was making the rounds on my newspaper beat this morning. No doubt this has happened before and I’ve just not noticed it, but the current forecasts are dry at all the basic time scales I watch closely. I lined ’em all up so you could share New Mexico’s pain:
Next seven days:
Next seven days
Six to ten days:
Six to ten days
Eight to fourteen days:
Eight to fourteen days
February-March-April:
February-March-April
May-June-July:
May-June-July
At the peak of the housing bubble in January 2006, when the annual pace of new home construction hit a blistering 2.29 million units, an estimated 14 percent of laborers in the construction sector were undocumented immigrants, including 20 percent of carpet, floor and tile installers, 28 percent of drywallers, and 36 percent of insulation workers. In September 2007, housing starts were down almost 50 percent, prices tumbled, and tens of thousands of migrants had lost their jobs.
Rubén Martínez, Desert America: Boom and Bust in the New Old West
Based on the latest federal forecasts (pdf from USBR here), we can expect Lake Powell to drop 20 feet this year and Lake Mead to drop 10 feet. That’s the midpoint forecast. Could be better if it snows. Could be worse. So far the trend based on the first half of January leans toward worse.
NOAA’s Colorado Basin River Forecast Center has built cool new graphical tools you can use to follow the pain in real time. Click on any of the little colored triangles to get the current forecast for unregulated flows at that river measurement point. The human forecasters expect 61 percent of average inflow into Lake Powell this year. The model “thinks” it’ll be more like 42 percent. Both have big error bars, depending on whether it snows between now and the start of meltoff.
Click on the “more info” link at the top of the little popup window and you get a graph like this:
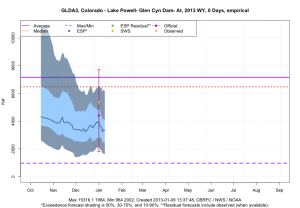
Lake Powell Inflow Forecast, courtesy CBRFC
Here’s how to read the graph.
A couple of things to note. The human-in-the-loop forecast is more optimistic than the model. The model has shown continued decline since the human forecast was issued. That’s ’cause it hasn’t been snowing much.
So it looks like we’ll have solar panels installed by the end of February. How long after that will it take for global warming to stop?
There’s a rich, historical elegance to the tradition of state-v-state lawsuits over interstate compacts. Because each of the US states is constitutionally sovereign, when they sue one another over water flowing down a river from one state to the next, the legal action begins and ends before the US Supreme Court – the court of “original jurisdiction”.
I am happy to report that I’ve got my own original jurisdiction case with the newly filed “Texas v New Mexico“:
Texas moved Tuesday to drag New Mexico before the U.S. Supreme Court, charging that New Mexico is mismanaging the Rio Grande in a way that deprives Texas farms and cities of water that rightly belongs to them.
The lawsuit alleges widespread groundwater pumping between Elephant Butte Reservoir and the New Mexico-Texas border that has effectively reduced flows in the river.
The bonus water of 2010-11 on the Colorado River, when Lake Mead jumped nearly 50 feet in surface elevation, is looking more and more like an anomaly. The Colorado Basin River Forecast Center issued its January forecast this week, with early snowpack pointing to a mid-point forecast of 61 percent of average flow into Lake Powell. It looks like it’s only about a 15 percent chance of enough snow between now and meltoff to get up to an average year.
Here’s a look at soil moisture then and now: December 2011 (coming off that unusually wet year) and now:
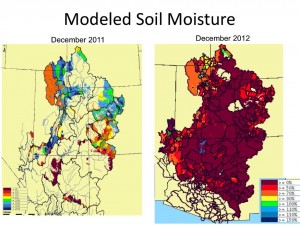
Colorado River Basin soil moisture
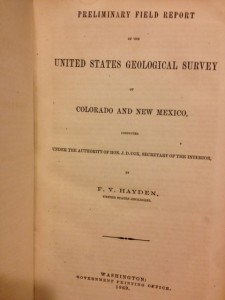
Hayden survey, 1869
In the summer of 1869, while John Wesley Powell was making his first journey down the Colorado River, Ferdinand V. Hayden, he of the famous Hayden surveys, was making a less notable journey down the eastern flank of the Rockies, from Colorado into New Mexico. Hayden’s primary purpose was geology, with an eye toward the region’s promise for mineral extraction. But he had with him the Rev. Cyrus Thomas, a botanist, whose task was, in part, to look at the region’s agricultural promise.
(I acquired a yellowed old copy this weekend of the survey party’s initial report to the Secretary of the Interior. You can read a slightly less yellowed copy here.)
The traditional narrative of the time, especially as told in Wallace Stegner’s Beyond the Hundredth Meridian: John Wesley Powell and the Second Opening of the West, has Powell as the lead character in trying to explain aridity to easterners headed west. But it’s clear from the initial observations of Hayden and his colleagues that Powell was not alone. Here’s Hayden at one point, describing western Nebraska:
These broad, level prairies are covered with a thick growth of short, nutritious grass, but the scarcity of water for the purpose of irrigation, and the almost entire absence of forest trees, must ever prevent settlements to any great extent. in the autumn nearly all the smaller streams dry up entirely.
And yet to the extent that flowing water was available to make up for the deficits of rainfall that eastern farmers counted on, Thomas sounded this strange (to our 21st-century ears) note of optimism about the necessity of irrigation:
This necessity is generally classed among the drawbacks to the agriculture of these territories, but there is some doubt as to the correctness of this conclusion, for, when we take into consideration the fact that where rain is depended upon there are frequently great losses incurred because of dry seasons, the question arises, “Is the loss by drought greater or less than the cost of irrigation?” The decision of this question must decide the point as to whether irrigation is really a drawback or not. That it is inconvenient and imposes a hardship upon the farmer of limited means, at the opening or settling of his farm, is true. But when his primary ditch is completed, if properly made, he may feel himself forever secure from loss through drought.
It hasn’t quite worked out that way.
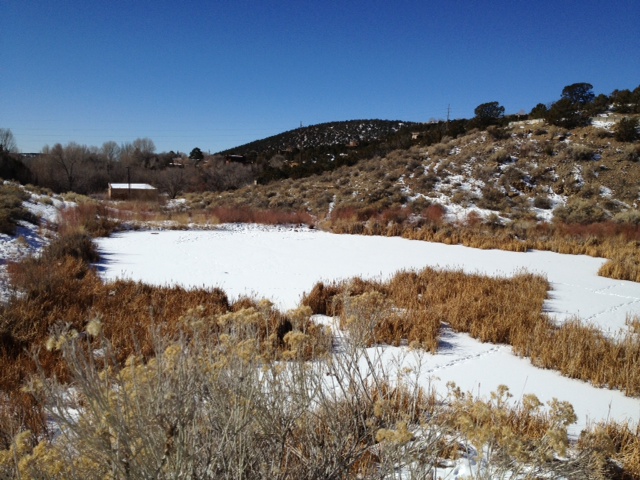
Two-Mile Dam Site, Santa Fe, NM
I went for a walk this morning at the old Two-Mile Dam site on the Santa Fe River east of Santa Fe, NM.
It’s two miles from downtown (hence the name), in the Sangre de Cristo foothills near the end of a road lined with wealth. Santa Fe is unusual in New Mexico as a city that has long relied on surface water. (Most cities here pump groundwater, though that is changing in complex ways.) In the late 1800s, the community built an earthen dam which must have been one of the largest dams of its day in New Mexico. The need for storage is a commonplace in this arid part of the world. If not for storage, communities and farms are limited by the available run-of-river flow in late summer, which is low. Storage allows you to cut the top off the spring runoff peak, saving it for late-season use.
Two-Mile held back 500 acre feet of water, but was rendered unnecessary in the 20th century by bigger reservoirs upstream (Nichols and McClure). In 1994, the dam was breached, leaving hilly abutments on either side of the canyon wall that one might not even notice save the park signs telling one where to look.
Breaching the dam was accompanied by a habitat restoration effort that included work by The Nature Conservancy, and today the valley floor that was once the reservoir’s bottom is home to a lovely cattail marsh. On the scale of dam breaching and restoration, it’s no Elwha, but it’s nice.