One of my favorite water books, Steven Solomon’s Water: The Epic Struggle for Wealth, Power, and Civilization, persuasively demonstrates that one can trace the geography of human history through our relationship with water – our great port cities and rivers as highways, our first great industrial power supply, the source of fertile soil and the irrigation needed to grow food, and so on.
Historian Carl Smith, in his new book City Water, City Life: Water and the Infrastructure of Ideas in Urbanizing Philadelphia, Boston, and Chicago, adds another layer to that story.
In richly detailed accounts of the development of three great urban U.S. municipal water systems, Smith shows how our very notions of what it meant for people to come together in urbanity intimately shaped, and were intimately shaped by, the need to provide water for America’s growing cities.
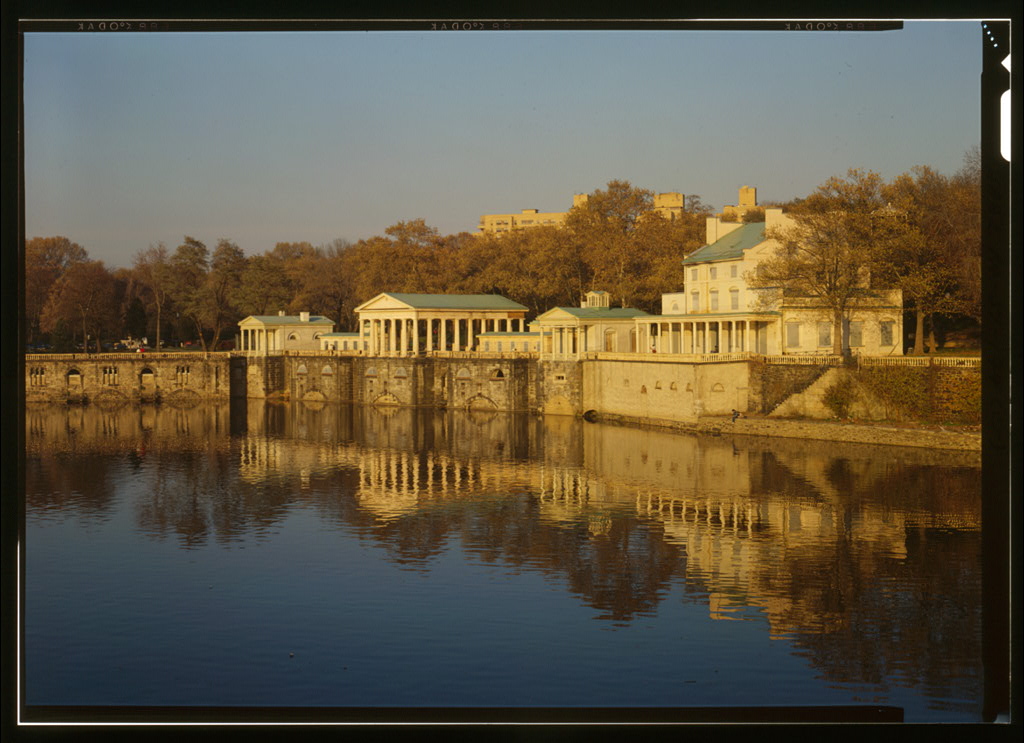
Fairmount waterworks, Philadelphia, courtesy US Library of Congress
It’s hard to overstate the significance of the cultural jump from the individualism of gathering one’s own water for one’s own home to the collectivism to banding together to build a water system. It was possible for newly forming cities in the United States in the early to mid-1800s to piecemeal roads and the like, but ultimately water systems required a new sort of collective action unlike anything urban communities had attempted to date.
It cities to think hard about what they expected to become, because along with grandiose ambitions came significant up front costs. If one imagined one’s city was going to rival London or Paris, one had to spend the money to build a big water system to achieve it, depending on growth and expanded revenue to pay the resulting costs. (Smith calls the pioneering issuance of bonds on never-before-seen scales “as momentous an event in American urban history as that of building the actual waterworks”.)
Smith describes the way water in abundance changed its role in the lives of city dwellers. Cleanliness, delivered by water, became associated with moral virtue and healthfulness (while also dramatically reducing the actual scourges of water-borne disease like cholera). Smith describes one Boston booster who
championed bathing the poor as a way to scour their slatternly characters as well as their dirty bodies, pointing out that this could only happen if clean water was made available to them.
Smith threads through his narrative examples of the way water brought into the cities also was used to recreate “nature” that was being lost through the shift to urban life. There were parks built within the cities, with fountains:
[T]he American nation’s presumed identification with nature, as well as a timeless concern with the dehumanizing tendencies of urban life, drove efforts to protect or restore the presence of the natural world in the city, even if that presence was nearly as fabricated as the grid.
There’s much more:
- the relationship between water system development and future growth
- the endless arguments over how to price city water
- the endless arguments over how to encourage conservation
For water nerds and urban history nerds, highly recommended.