Deadpool Diaries: Lower Basin use on track to be lowest in nearly four decades

Projected Lower Colorado River Basin water use, as a percentage of each state’s total allocation


I’ve emerged from my cozy book writing cave (The new book’s going well, thanks for asking!) to some stunningly optimistic Lower Colorado River Basin water use data.

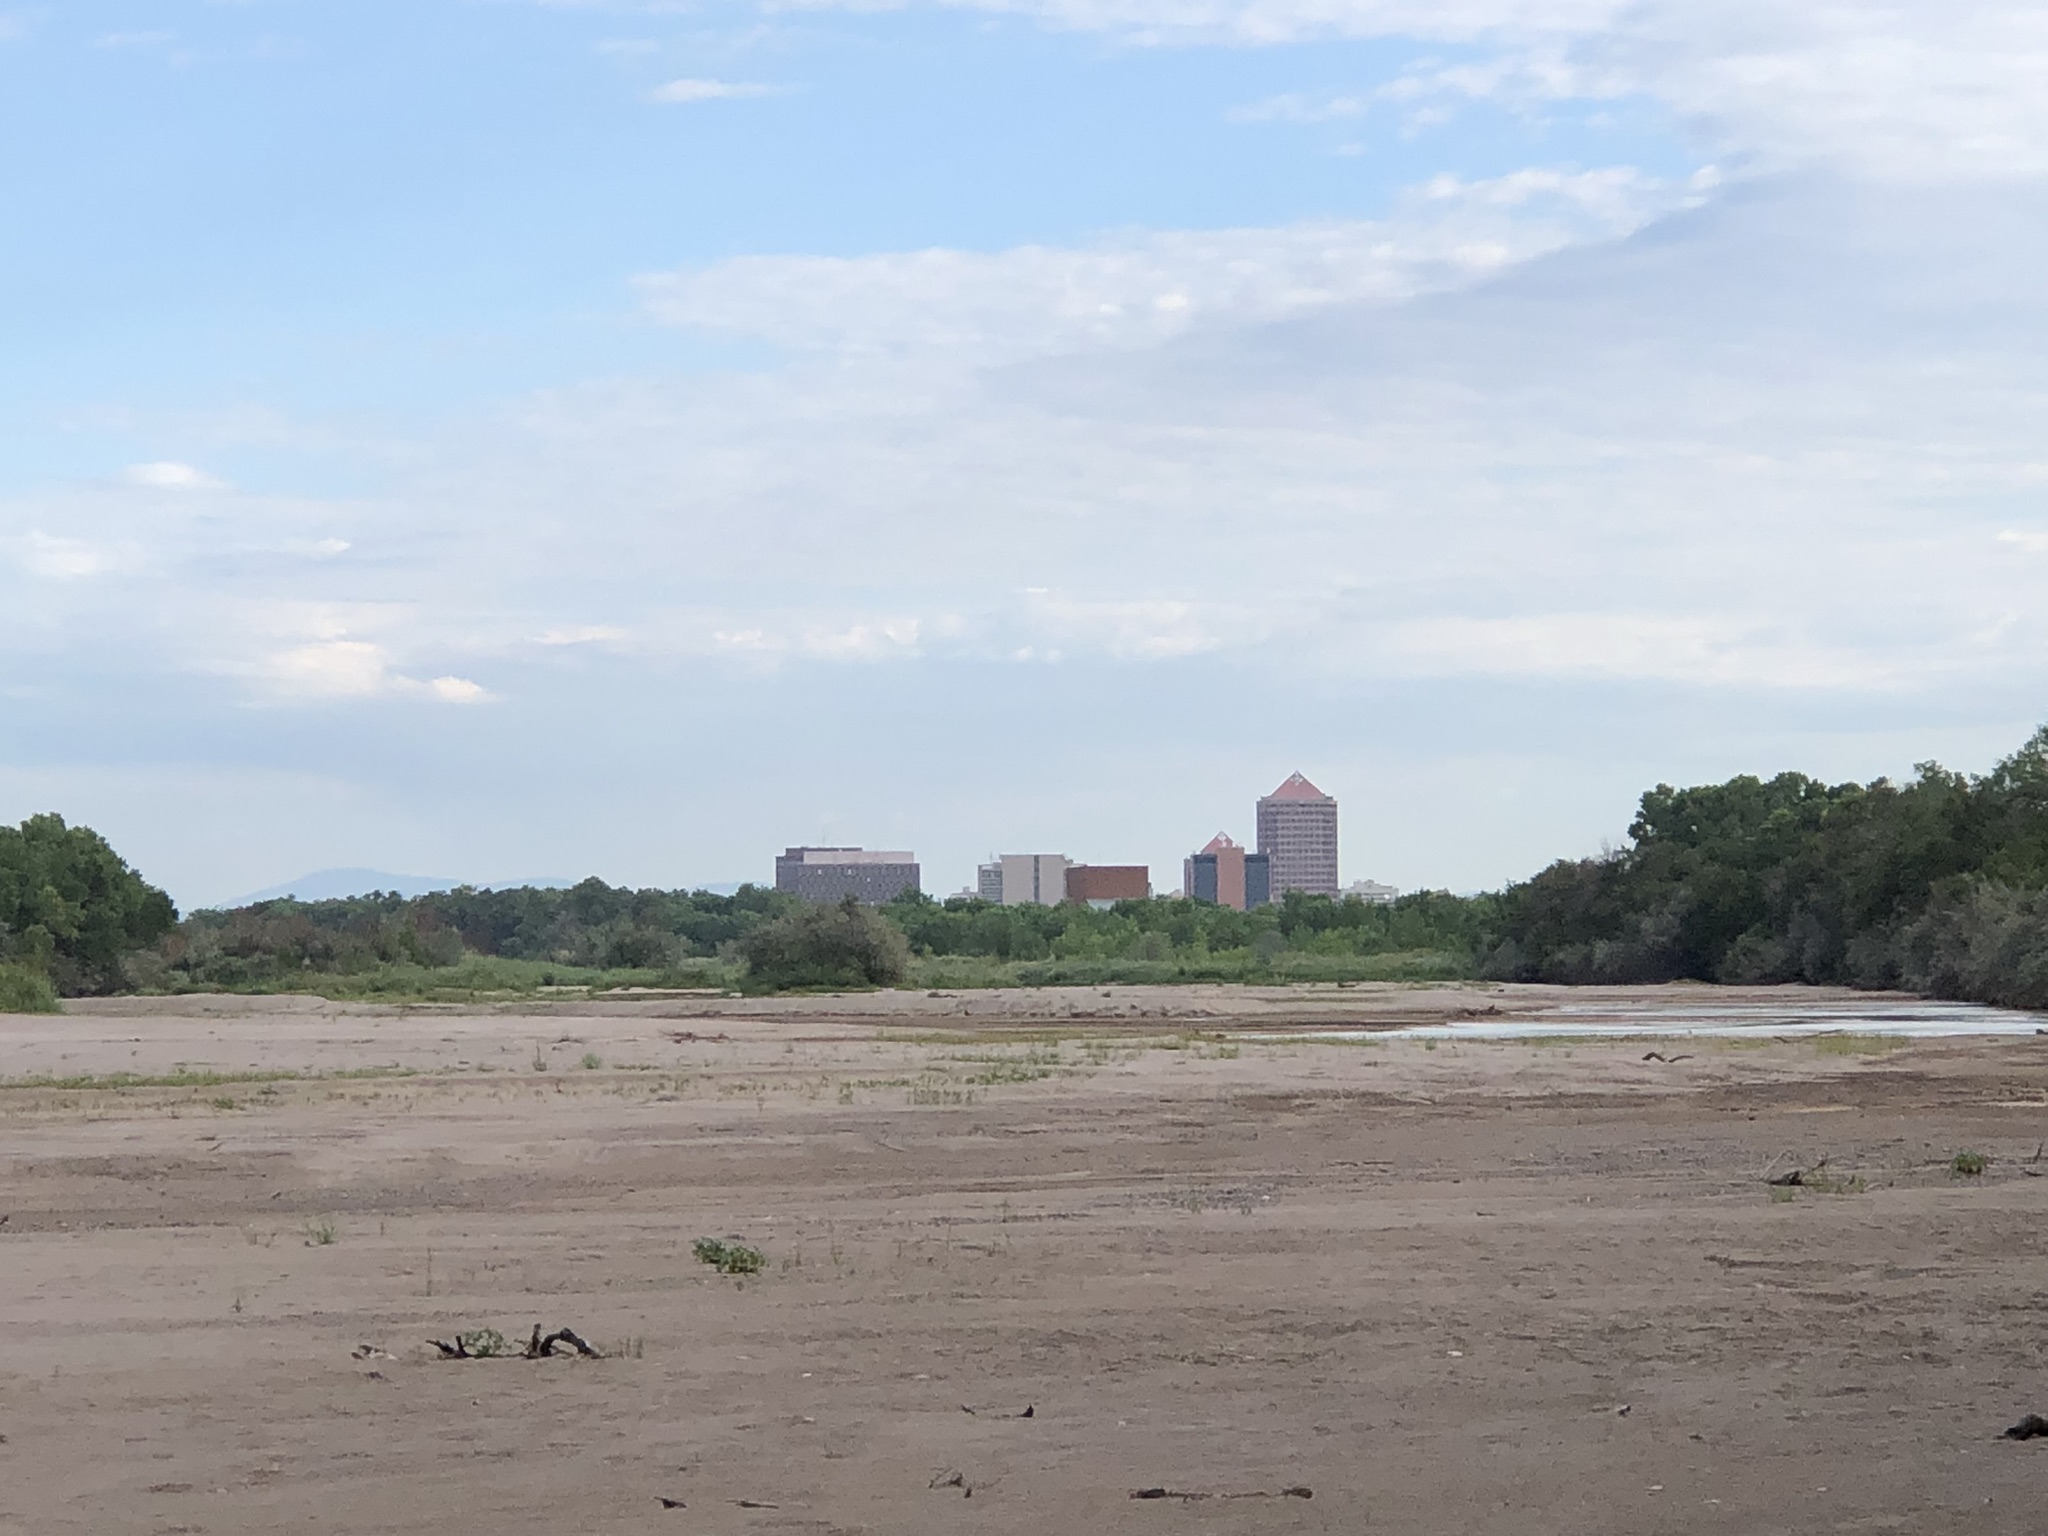
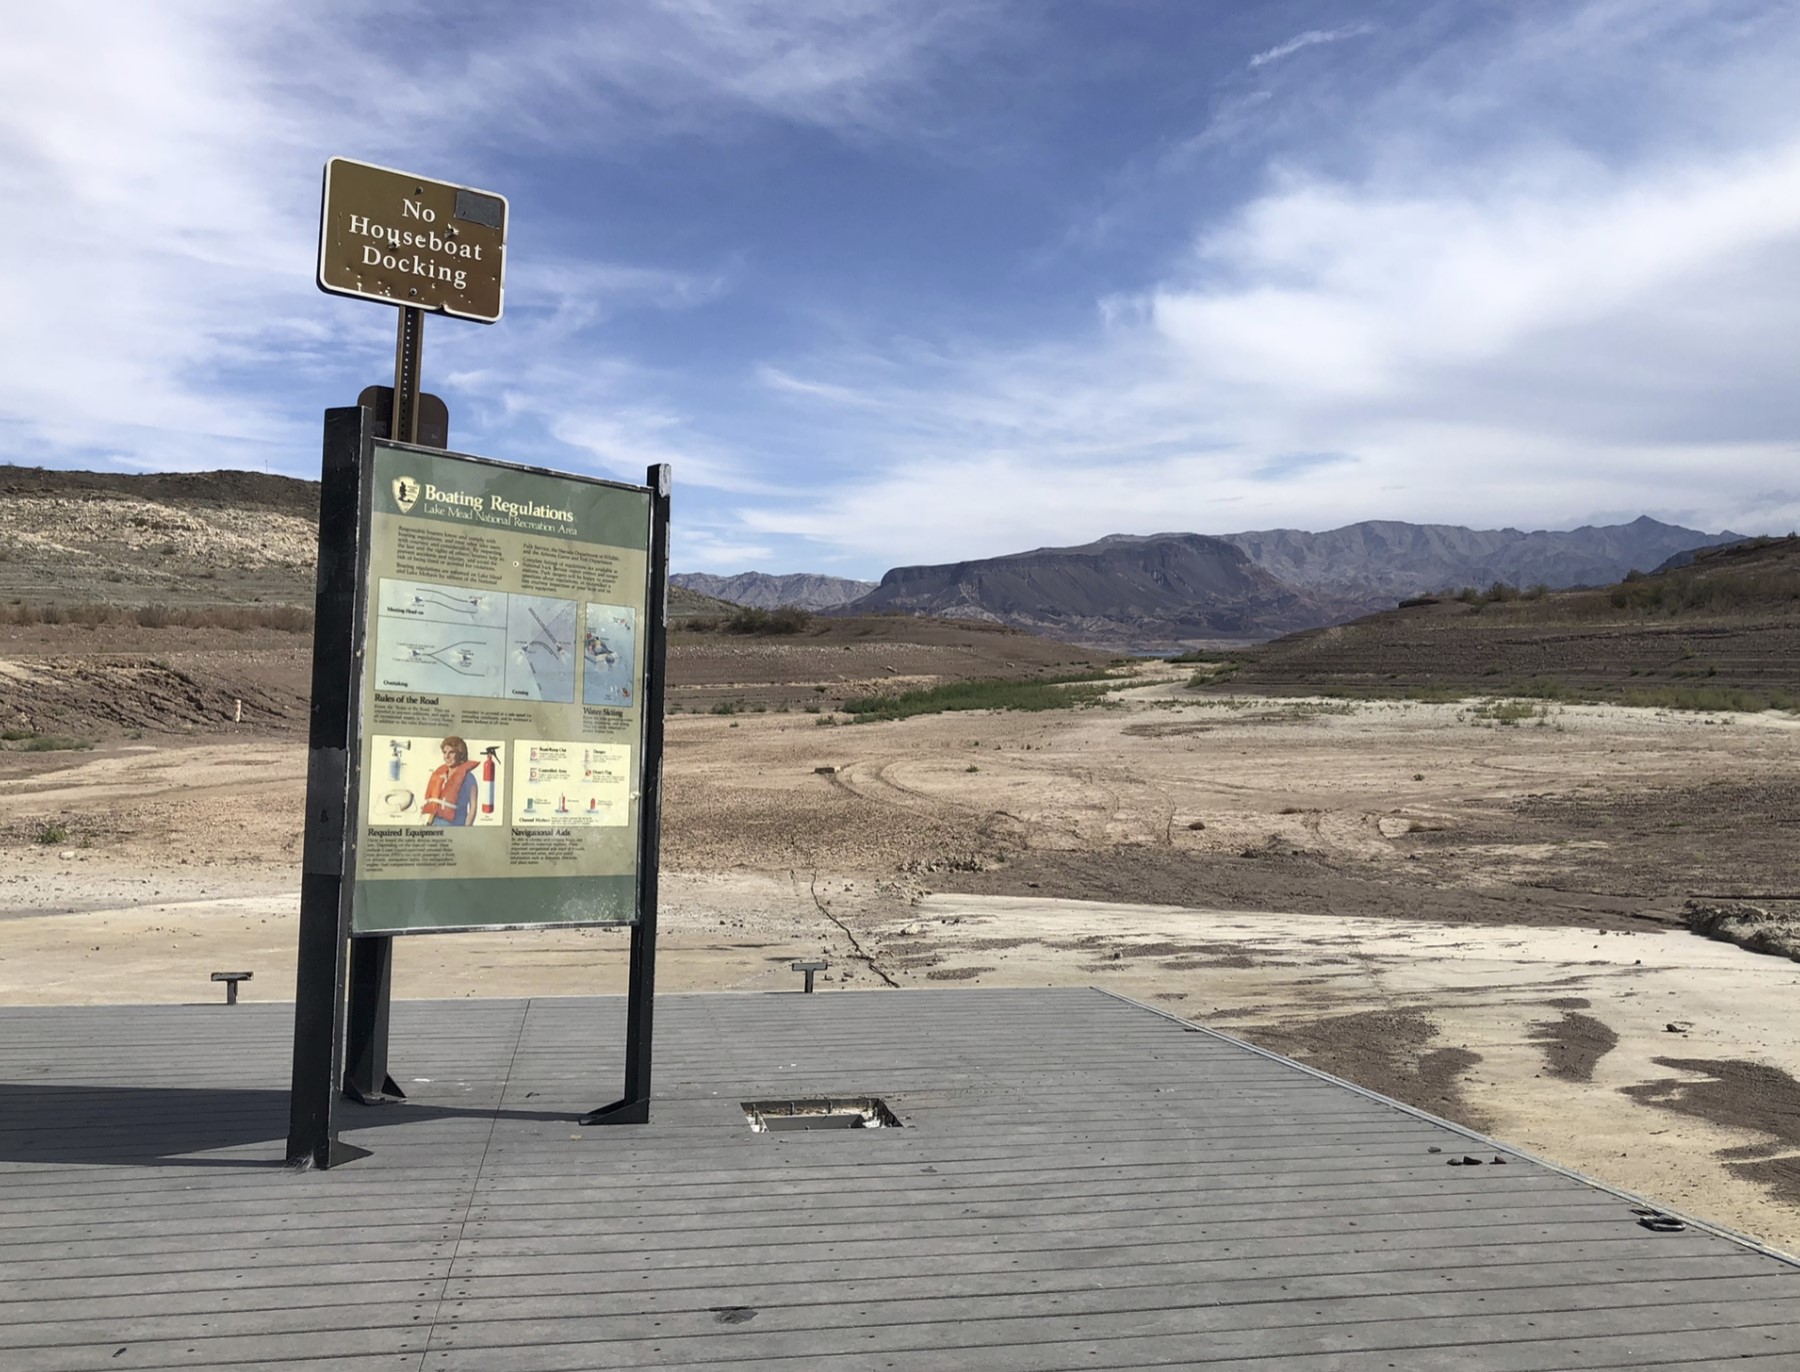
Forecast use in 2023 (based on the Sept. 18 USBR forecast model) has dropped below 6 million acre feet, currently just 79 percent of the total baseline Lower Basin allocation of 7.5 million acre feet. Californians are on track for their lowest take on the river since 1949, according to my crazy stitched-together dataset (USBR decree accounting reports plus pre-1964 numbers assembled some time ago by some folks at MWD).

Arizona and Nevada’s use is the lowest its been since 1992.

Relative to their baseline allocations, Arizona (at 69 percent) and Nevada (at 65 percent) are still doing the heaviest lifting, but California (at 86 percent) is seriously pitching in too.

State/Total 2023 Use (acre-feet) % of Total Allocation Last Year Use Was This Low
Arizona 1,921,944 68.64% 1992
California 3,788,609 86.10% 1949
Nevada 193,599 64.53% 1992
Total US Lower Basin 5,904,152 78.72% 1984


Because bits are cheap, here’s the full dataset back to 1964. Source is the USBR’s Water Accounting reports, with a huge thanks to Sami Guetz at UCSD for help earlier this year QA’ing the numbers:

year Arizona California Nevada total
1964 1,127,176 5,064,733 25,297 6,217,206
1965 1,008,531 4,899,987 22,716 5,931,234
1966 1,073,055 5,096,912 26,656 6,196,623
1967 1,106,894 4,886,734 27,190 6,020,818
1968 1,169,240 5,072,533 33,614 6,275,387
1969 1,138,085 4,896,527 37,392 6,072,004
1970 1,201,441 5,015,018 38,308 6,254,767
1971 1,296,930 5,216,300 50,586 6,563,816
1972 1,203,043 5,230,635 81,051 6,514,729
1973 1,268,744 5,317,547 92,649 6,678,940
1974 1,325,631 5,414,040 94,889 6,834,560
1975 1,358,003 4,983,705 72,140 6,413,848
1976 1,248,020 4,706,594 73,192 6,027,806
1977 1,231,274 5,097,343 73,174 6,401,791
1978 1,234,942 4,503,340 71,293 5,809,575
1979 1,150,853 4,788,423 60,074 5,999,350
1980 1,169,657 4,725,496 92,426 5,987,579
1981 1,415,850 4,795,949 110,017 6,321,816
1982 1,240,384 4,299,799 102,326 5,642,509
1983 1,062,169 4,245,045 86,596 5,393,810
1984 1,122,399 4,677,103 101,492 5,900,994
1985 1,194,208 4,778,749 101,709 6,074,666
1986 1,356,930 4,803,676 112,217 6,272,823
1987 1,734,172 4,891,961 108,863 6,734,996
1988 1,922,737 5,039,679 129,420 7,091,836
1989 2,229,967 5,144,417 156,213 7,530,597
1990 2,260,272 5,219,457 178,111 7,657,840
1991 1,864,360 5,005,595 180,224 7,050,179
1992 1,906,071 4,546,192 177,551 6,629,814
1993 2,246,695 4,835,017 204,402 7,286,114
1994 2,152,410 5,234,088 227,542 7,614,040
1995 2,221,346 4,925,480 217,439 7,364,265
1996 2,714,754 5,322,652 249,248 8,286,654
1997 2,853,886 5,250,119 242,777 8,346,782
1998 2,566,707 5,045,228 245,303 7,857,238
1999 2,727,960 5,194,380 291,130 8,213,470
2000 2,802,758 5,162,211 321,984 8,286,953
2001 2,841,028 5,254,718 315,429 8,411,175
2002 2,969,230 5,365,609 326,718 8,661,557
2003 2,830,599 4,408,746 298,392 7,537,737
2004 2,784,645 4,316,185 283,006 7,383,836
2005 2,428,469 4,344,258 291,778 7,064,505
2006 2,782,866 4,335,299 292,864 7,411,029
2007 2,783,323 4,370,695 300,312 7,454,330
2008 2,752,497 4,498,810 269,654 7,520,961
2009 2,831,711 4,358,074 248,613 7,438,398
2010 2,780,367 4,356,839 241,437 7,378,643
2011 2,781,108 4,312,661 222,847 7,316,616
2012 2,789,667 4,416,718 237,161 7,443,546
2013 2,778,867 4,475,789 223,563 7,478,219
2014 2,774,661 4,649,734 224,616 7,649,011
2015 2,604,732 4,620,756 222,729 7,448,217
2016 2,612,833 4,381,101 238,326 7,232,260
2017 2,509,503 4,026,515 243,425 6,779,443
2018 2,632,260 4,265,525 244,103 7,141,888
2019 2,491,707 3,840,686 233,996 6,566,389
2020 2,470,776 4,059,911 255,568 6,786,255
2021 2,425,736 4,404,727 242,168 7,072,631
2022 2,014,176 4,445,255 223,670 6,683,101
2023 1,921,944 3,788,609 193,599 5,904,152

Watching Albuquerque’s Rio Grande go dry

Sandy riverbed flanked by trees with city buildings in the distance.

Albuquerque’s Rio Grande, drying

There’s so much going on in this picture.

The buildings on the horizon, downtown Albuquerque, are a couple of miles away – foreshortened by the camera’s zoom. It’s a modest downtown, which grew up in that spot 140 years ago because the real estate entrepreneurs collaborating with the newly arrived Athchison, Topeka, and Santa Fe Railway were able to get the land cheap. The spot where Albuquerque’s downtown sits today was basically a swamp.

If you look closely in the picture above, you can see a bit of water, a languid meander across the sand beds of a rapidly shrinking river. When I went out this morning (Sunday, Sept. 3, 2023) the Rio Grande through the Albuquerque reach was still “connected”, in the words of the river managers. But barely. The river that is central to this community’s creation story is about to go dry.

The Formalisms of a Dying River

In the parking lot by the old Barelas Bridge this morning, I ran into one of the members of the RiverEyes team, a young person of my acquaintance who bicycles through the riverside woods, checking at regularly spaced access points to see if the river is still connected. The operation is part of the staggeringly complex social-hydrological-institutional apparatus around this stretch of the river.

The monitoring effort (referred to as “RiverEyes”) assists with meeting requirements under Reasonable and Prudent Measure 4, and Terms and Conditions 3.2, 9.1, and 9.2 of the December 2016 Final Biological and Conference Opinion for Bureau of Reclamation, Bureau of Indian Affairs (BIA), and Non-federal Water Management and Maintenance Activities on the Middle Rio Grande, New Mexico (2016 BO).

The RiverEyes observations feed into the elaborate effort to stave off the extinction of a fish called the Rio Grande silvery minnow (Hybognathus amarus), which survives only in a couple hundred miles of the Rio Grande through central New Mexico. And in hatcheries. We’ve been doing RiverEyes-like monitoring since 1996. River drying is common south of town, but last year was the first time we needed to monitor here, through Albuquerque. This is the second.

On Friday, there were 30.6 miles of dry channel in the San Acacia Reach 75 miles downstream from Albuquerque. There were 3.6 dry miles in the Isleta Reach, 20 miles downstream from Albuquerque. Sampling in one of the wet parts of the San Acacia reach found 615 juvenile silvery minnows and 14 adults.

Here, we count fish.

The “death” of “a living river”?

Some years ago, a consulting firm ran a series of interviews and focus groups among Albuquerque residents to try to better understand their attitudes toward the Rio Grande. They found that residents viewed water issues – their supply – as a major concern. The river, not so much.

The Rio Grande, in fact, was kind of an embarrassment to local residents, the consultant found – small and struggling, not what a “real” river is supposed to look like.

Though, to be fair, even with lots of water, the Rio Grande here looks nothing like what a “real” river is supposed to look like. In a more natural state, before we built a city here, the Rio Grande wandered a broad flood plain, five miles wide in places. The narrow 600-foot channel you see in the picture at the top is a 20th century creation, begun in the 1930s with levees, expanded in 1959 in a project the U.S. Bureau of Reclamation called “channel rectification” meant to turn a meandering river into a more efficient water delivery canal.

In response, the flood control works created ideal habitat for the development of the cottonwoods you see flanking the river, and the magnificent gallery forest we call the “bosque” grew alongside the river for most of its 200-ish miles through central New Mexico.

Triangular steel contraption known as a "jetty jack", which looks like a children's "jacks" toy, but about ten feet high. WIth trees in the background.

I’m hunting for a good jetty jack photo for the book. This isn’t it.

Riding this morning with a friend on a twisting path through the bosque, looking for spots to get out to the river channel to see for ourselves, we had to periodically stop and carefully navigate through “Kellner jetty jacks”, big metal contraptions installed in the ’50s as part of the “rectification” effort. Their job was to slow water and hold sediment and enhance the narrowing of the river channel. In so doing, the trapped sediments made ideal seed beds for the opportunistic cottonwoods. They also can be gnarly if you’re cycling, with cables that can snag a pedal, and sharp edges that can cut out a chunk of flesh if you’re not careful.

They also are a reminder of how profoundly unnatural this lovely natural-seeming park, which I so love, really is.

In the circles in which I spend my time, there’s a lot of talk about how to maintain a “living river” here, which is an interesting conceptual framework. Maybe it means simply continuous flowing water? But the whole system is so completely hydrologically (and therefore ecologically) altered by human interventions that we quickly end up down a deep and confusing conceptual rabbit hole when we try to think too hard about what “natural” and “living river” might mean. The terms might help us think well about desired future conditions. But they also can mislead.

The part about how it’s going dry

Weirdly, the Rio Grande is going dry this year through Albuquerque for the second time in the last four years because of a lack of plumbing. El Vado Dam on the Rio Chama, a tributary, is under repairs. Normally we’d store water from the spring runoff, using it to stretch out the river’s flows into the dry months of late summer and early fall. If we’d had El Vado storage this year, I’m told, the river would have been still flowing in the spot where I was standing to take the picture at the top of the post.

Without El Vado storage, the river here will likely dry through the lower end of the Albuquerque reach early next week. The RiverEyes team is on it. They’ll let us know.

Forests to Faucets (and Headgates!)

People standing in a forest clearing with pickup trucks in the background.

Informal collaborative governance in action

I spent a couple of days last week out of Pagosa Springs in southern Colorado, touring forest restoration work in the headwaters of the San Juan-Chama Project, which produces critical water supplies for central New Mexico. In others words, water for my neighhbors and me.

We’ve learned over and over in the last couple of decades the risk to city water from wildfire in our headwaters, and the benefits of forest restoration. But the institutional path to restoration is challenging – because of cost, because of the complicated mix of land ownership, and because of the distance (both physically and also conceptually) between the mountain watersheds and the people who depend on the water they supply.

I came away optimistic about the creative problem solving I saw. This stuff’s hard, especially to do at the scale needed, but the efforts are impressive.

Forest to Faucets (and Headgates)

A few years back, my University of New Mexico collaborator Bob Berrens helped guide a research project intended to flesh out the relationship between Albuquerque and the distant headwaters (a ~200 mile drive away) that provide a critical piece of our water supply.

Reducing wildfire risk through forest restoration is vital for the sustainability of watersheds and the human systems that depend upon them. However, identifying public support and securing necessary funding to cover restoration costs is an important implementation challenge. Payment for ecosystem services models may help meet restoration objectives

That’s from the resulting paper, Adhikari, Dadhi, et al. “Linking forest to faucets in a distant municipal area: Public support for forest restoration and water security in Albuquerque, New Mexico.” Water Economics and Policy 3.01 (2017): 1650019. Using a contingent valuation survey (a technique Bob’s used for many years to help us get our heads around non-market values of stuff related to water resources, see for example here on the endangered Rio Grande Silvery minnow), the research group found:

  • a mean willingness to pay of $64 per household, which equates to $7 million a year flowing out of Albuquerque to help support forest restoration in the watershed on which we depend, and
  • even households far away from watersheds support shelling out cash to pay for the work – not just communities like Santa Fe that can look up from their back porch to see their watershed (more on this later – in addition to its back porch watershed, Santa Fe also gets water from the San Juan-Chama headwaters)

Collaborations at the watershed scale

While in Pagosa Springs and the surrounding watersheds, we got to see and learn about an amazing set of collaborations involving the Forest Stewards Guild, the Chama Peak Land Alliance, and The Nature Conservancy’s Rio Grande Water Fund, which provides a crucial conduit for the “payment for ecosystems” model Bob’s work talks about.

One of the keys to making this work is a business model – the money supports folks in communities like Pagosa Springs who actually drive the masticators (big machines that grind up overgrown forest stuff). It’s part of the rural-urban social contract Bob and I talk about in the UNM Water Resources Program class we’re teaching this fall.

Collaborations at the regional water management scale

Bob’s called this stuff “forests to faucets”, but what we’re seeing this year on the Rio Grande through central New Mexico is a reminder that the Middle Rio Grande Conservancy District, and the river channel itself, also depend on the importation of San Juan-Chama Project water across the continental divide. Absent the SJC water over the last couple of months, the MRGCD’s ditches would have gone dry sooner, as would the river channel. (Both ditches and river channel are starting to go dry as we speak, after MRGCD’s San Juan-Chama water ran out, but that’s a topic for another blog post.)

The organizer of last week’s tours was the San Juan-Chama Contractor’s Association, a group formed several years ago to try to create a framework for collective action among the New Mexico water agencies that use this imported water. Other states have umbrella agencies to organize big parts of their Colorado River water management – the Central Arizona Water Conservation District (“CAP”) in Arizona, the Metropolitan Water District of Southern California, and the Southern Nevada Water Agency (Las Vegas NV). In New Mexico, we have a bunch of separate San Juan-Chama Project water users, each with their own contract with the Bureau of Reclamation. The SJC Contractors Association has created a framework for thinking about collective action on things like physical infrastructure costs and maintenance – and forest restoration!

Key Rio Grande Valley players in attendance were leadership from Albuquerque, Santa Fe (which in addition to San Juan-Chama water, gets supplies from its own local Sangre de Cristo watersheds, which have forest health challenges too) and the Middle Rio Grande Conservancy District.

Social Capital

In addition to spending time in drop-dead gorgeous mountain watersheds, last week’s tours and meetings also created a great framework for sitting out on the back patio at Motel SOCO in Pagosa Springs eating delicious bar food and drinking our choice of beverages and building social capital. Bonus points for the tours organizers for getting the forest nerds and the water nerds talking.

Great fun was had by me.

A John Fleck Colorado River Discography

Fleck, Morelos Dam, 2014.

Doing the usual just-in-time tweaking of the fall class (like my old artist friend from L.A. who made a living scraping and painting freighters while they shipped up and down the West Coast), I’m updating the course’s Colorado River module.

I’d never actually pulled together a bibliography of my own stuff. Books, academic literature, significant grey literature, and one significant newspaper piece. Some of it’s Wonky and Important, some Breezy and Readable, a couple of things that I’m extraordinarily proud of (the books) I think managed to be both.

It’d cruel to make ’em read it all, some of this is pretty dense. But there’s some good stuff in here!


2016


Fleck, John. Water is for fighting over: And other myths about water in the west. Island Press, 2016.

Fleck, J. (2016). High tech desert: the great decoupling of the west’s water. The Breakthrough Journal, Summer 2016, 6.


2019


Kuhn, Eric, and John Fleck. “The Upper Basin, Lower Basin, and Mexico: Coexisting on the Post-2026 Colorado River.” Science Be Dammed Working Paper Series 2 (2019).

Fleck, John, et al. “The Evolution of Our Understanding of the Natural Flow of the Colorado River at Lee’s Ferry and its Importance to Critical Development Decisions.Science Be Dammed Working Paper Series 2019-01 (2019).

Castle, Anne, and John Fleck. “The risk of curtailment under the Colorado River compact.Available at SSRN 3483654 (2019).

Kuhn, Eric, and John Fleck. Science be dammed: How ignoring inconvenient science drained the Colorado River. University of Arizona Press, 2019.


2020


Jones, Benjamin A., and John Fleck. “Shrinking lakes, air pollution, and human health: Evidence from California’s Salton Sea.Science of the Total Environment 712 (2020): 136490.

Fleck, John, and Brad Udall. “Managing Colorado river risk.” Science 372.6545 (2021): 885-885.

2021

Fleck, John, and Anne Castle. “Green light for adaptive policies on the Colorado River.Water 14.1 (2021): 2.


2022


Kuhn, Eric, and John Fleck. ““The Consequences of the Compact Remains with Us”: Challenges and Opportunities for the Colorado River Upper Basin.” Available at SSRN 4094375 (2022).


2023


Fleck, John, and Eric Kuhn. “An Historical Perspective on the Accounting for Evaporation and System Losses in the Lower Colorado River Basin.Science Be Dammed Working Paper 4 (2023).


Fleck, John. “California Wants to Keep (Most of) the Colorado River for Itself.” New York Times, Feb. 23, 2023.

Deadpool Diaries: rekindling optimism?

Lake Mead used to be here. October 2022. Photo by John Fleck

Something remarkable is happening this year in the Lower Colorado River Basin that provides both a glimmer of hope about what durable basin solutions might look like, and also a clear demonstration of the obstacles still standing in their way.

Nevada’s Colorado River water use is on track to be the lowest it’s been since 1992

Southern Nevada’s projected 2023 use right now (the following is based on Reclamation’s Aug. 14 water forecast run) has dropped below 200,000 acre feet, sitting today at 199,943 af. That would be Nevada’s lowest take on the Colorado river since 1992. Southern Nevada’s population (Clark County, basically “greater Las Vegas”) has nearly tripled in that time.

Nevada has demonstrated its ability to take deep cuts without jeopardizing the structure and function of the communities that depend on Colorado River water.

Arizona’s Colorado River water use is on track to be the lowest it’s been since 1992

Arizona’s projected 2023 use, 1,974,819 acre feet, has dropped below 2 million acre feet, also the lowest since 1992. The Central Arizona Project, which supplies the Phoenix-Tucson area, is projected to take just 605,171 acre feet this year. That is 40 percent of CAP’s 21st-century average.

Arizona has demonstrated its ability to take deep cuts without jeopardizing the structure and function of the communities that depend on Colorado River water.

California’s Colorado River water use is on track to be the lowest it’s been since 2019

California’s use has dropped below 4 million acre feet, which would be the first time that’s happened since 2019, currently 10 percent below the state’s 21st century average.

Ok, the comparison is striking, right? Some states are doing a lot, other states are doing less. But I’m trying to be optimistic here, California’s water use reductions aren’t nothing! Everyone’s using less water!

But the relative depth of California’s cuts has not yet demonstrated its ability to take deep cuts without jeopardizing the structure and function of the communities that depend on Colorado River water.

The numbers

State Base allocation 2023 2023 reduction percent cut from base 07/DCP Cut beyond 07/DCP
California 4,400,000 3,997,677 402,323 9.1% 0 9.1%
Arizona 2,800,000 1,974,819 825,181 29.5% 592,000 8.3%
Nevada 300,000 199,943 100,057 33.4% 17,000 27.7%
Total 7,500,000 6,172,439 1,327,561 17.7% 609,000 9.6%


The Obstacles

The premise of a piece I wrote earlier this year in the New York Times is that there’s no way we can fix the Colorado River supply/use imbalance if California insists that the burden of overallocation and climate change fall on everyone else.

The new Schmidt/Yackulic/Kuhn paper puts the needed cuts at 20 percent just to stabilize the system – more if we’re going to rebuild a buffer against a repeat of last year’s shit show. Arizona and Nevada have figured out how to cut a lot more than that.

California, not so much.

A clarifying note on the picture

The above picture, which I took in October, no longer represents reality. Based on the latest Sentinel satellite imagery, a bit of water has returned to Boulder Harbor on Lake Mead’s western shore.


Weirdness on the edge of town

Two trees and an old mattress on a sandy wasteland with mountains in the background.

Weirdness on the edge of town.

Where no one asks any questions
Or looks too long in your face
In the darkness on the edge of town.

– Bruce Springsteen

Do you believe in ghosts? Or crows? Do you at least believe in crows?

Three of them. Possibly four. Crows, or possibly ravens. But I’d rather they be crows, so let’s call them that, because then they can be a murder of crows. Poe’s raven was alone, “Nevermore.” So crows it is. Their squawking, but in sentences, trying to tell me a story I couldn’t understand, gave me shivers.

I was alone on a bike, in a place too sandy for a quick escape, riding the hard packed bits, walking the sand, when I came upon the crows, beyond the pile of old mattresses and sofas and undifferentiated junk of a place lived in rough and cleared out fast. Because of my old arthritic feet, I try not to do too much walk-a-bike on the sand, but the crows urged me on. I didn’t trust them, but I went.

I was riding Albuquerque’s Central Avenue, Route 66, up Nine Mile Hill, past the edge of strip malls and subdivisions and safety, where the weirdness begins. Out dirt roads here are ragged houses with the kind of ratty “No Trespassing” signs you take seriously.

During the pandemic, this bit of the sandhills was home to a cluster of old RVs and camper vans, and I rode out there a lot in those dark months but never had the nerve to turn in. I’ll ride almost anywhere. “I’m so sorry,” I say, my excuse at the ready, gesturing at the computer on my handlebars, “the GPS said this was a road.” But I never had the nerve to turn in here. The place had a “For Rent” sign tacked on a makeshift gate back then, a light pole that looked like it might actually have electricity, and a mobile home that looked sorta permanent.

That’s all gone, all but the trees, which are a weird sight on the sandhills. How could there be trees here? Do you believe in ghosts? Or crows? Do you at least believe in crows?

When the crows had lured me in close, I saw a makeshift shelter hunkered low, so you couldn’t see it from the highway, tarpaper and scrap wood. And another. And another, at least three before I turned and beat it.

That’s when I noticed them, on the way out. Fresh tire tracks, since last week’s rain.


On the shortcomings of the way we measure water “use”

When I first got serious many years ago about the project of writing (in the newspaper at the time) about New Mexico water, I went looking for the numbers. How much do we have? Who uses what?

It’s a task that became central to my work. Eric Kuhn and I spent three years writing an entire book about the importance of having good numbers and using them to make good decisions.

As I prepare for another fall semester with first year water resources grad students, the question is fresh upon my mind. We spend a lot of time helping students up the bottom slopes of the “water numbers” mountain.

It’s doubly fresh because I’m in the midst of working up, with my Utton Center colleague Kate Tara, input in response to the U.S. Department of Interior’s request for comment on the agency’s post-2026 Colorado River management guidelines. A call for good data, used well, is key to our comments.

In preparing our comments, I had occasion this morning to re-read a really useful paper published earlier this year by Amy McCoy and colleagues about Colorado River data. The paper’s focus is a deep dive into the Bureau of Reclamation’s Lower Colorado River Decree Accounting reports, which to a water data nerd like me, writing about the Colorado River, have long served as a mineable lode of water policy ore. Which they are. But McCoy et al make a crucial point that I tend to forget: In my search for answers to the questions of “how much do we have” and “who uses what”, we can miss things that are incredibly important, but that fall through the cracks of this kind of an epistemology:

Water accounting in river systems endeavor to monitor and track diversions, deliveries, inefficiencies, and savings. Theoretically, water accounting creates transparency for the public, and can be a tool to improve river and water management, particularly as demands grow and supplies are nearly or fully allocated. However, accounting also reflects the historic cultural conditions that were in place when water laws, policies, and infrastructure were initially developed in the modern era. Rivers are complex systems, and accounting often takes a focused lens on elements that directly relate to the economy, such as consumptive use for agriculture and cities. This focus excludes complex elements that are difficult to track, that are not a direct part of the economic system, that are nonconsumptive uses, or that do not have legal allocations or entitlements. In the Colorado River system, elements outside of the historically constructed legal and accounting systems have included environmental uses, tribal water, and in many cases, groundwater. Because these water uses have not been accounted for, any degradation or changes can more easily go unnoticed.

This epistemology biases us toward ignoring important things.

The paper is McCoy, Amy L., et al. “A Survey of the Bureau of Reclamation’s Decree Accounting Reports in the Lower Colorado River Basin.” Journal of Water Resources Planning and Management 149.3 (2023): 04022085. (I think it’s here and not paywalled, though I sometimes can’t tell because I’m writing this on a computer on the university network.)

Breaking Albuquerque’s flash drought: Biggest monsoon storm in a decade

Map of Albuquerque showing Aug. 8, 2023 preciptiation, with amounts ranging from less than a tenth of an inch on the west side to 2 inches in the eastern foothills.

Breaking a flash drought: Aug. 8, 2023 rainfall in Albuquerque, Courtesy CoCoRaHS

August 8 is more than a little late for Albuquerque’s first solid monsoon rains to break our weirdly hot flash drought, but we’ll take it.

Typical monsoon onset here is early July, plus or minus a week-ish. At the risk of overstating because of a lack of precision, Aug. 8 is record late.

I was on a Zoom yesterday with a group of Colorado River colleagues when my phone started pinging insistently with the family’s traditional “rain here!” and “thunder!” from the various Fleck and Co. outposts scattered around Albuquerque’s city center. The rainfall numbers from CoCoRaHS volunteers, shown above, show a classic monsoon storm variability, but you can see the numbers growing as the cell(s) rolled up toward the foothills on the eastern side of the map.

Biggest Monsoon Storm by Fleck’s favorite measure in a decade

One good measure of the scale of these storms with respect to the city is Albuquerque’s North Diversion Channel, which collects runoff from the city’s built-up Northeast Heights, where most of us live. The channel integrates across a much more meaningful area than any single rain gage – the area where a bunch of us (including me!) live. The NDC peaked yesterday afternoon a bit after 3 p.m., just after my Zoom ended, at 7,630 cubic feet per second. That’s not a meaningful number for lots of you, so by point of comparison it’s our biggest NDC flow (and therefore the biggest single monsoon storm across this part of the city) since July 2013. (USGS data sources: NDC gage)

Ribbons of Green

For the new book, we’re writing a series of vignettes that track the Rio Grande over the course of a single year. For convenience sake, we’ve chosen this one (duh), so this stuff’ll go into the book. One of the tricks I’m using – this may not go into the book, it’s one of those “Danger, Fleck Doing Math!” things – is to monitor gages at the north end of the Albuquerque reach and the south end, a crude mass balance metric of how much water is being consumed in our stretch of the middle valley. This morning’s additions to my spreadsheet showed the reach adding water for the first time since I started keeping track. Usually we subtract water – which is to say, evaporation in this stretch of the river is what keep’s the valley green.

All of the storm’s water dumps into the Rio Grande in a hurry, through a network of concrete diversions channels mostly built in the 1970s as the city spread up onto the mesa on the river’s east side. It’s a sharp peak at the NDC outfall, but by the time the pulse reached the Central Avenue Bridge ~8 p.m. (five hours’ travel time) it was down to ~2,500 cfs. The volume of water probably shrank as some of it spread out into the bosque, but mostly it just spreads out in time, a sort of sloshing effect.


Albuquerque shutting down its river diversions because of low Rio Grande flows, going to groundwater

Stream entering a muddy river channel.

July 22, 2022, when wastewater from Albuquerque’s sewage treatment plant was the only thing keeping the Rio Grande here wet

Area water managers were informed this morning that the Albuquerque Bernalillo County Water Utility Authority will shut down its diversion of water from the Rio Grande for use in the municipal drinking water system, switching over to groundwater pumping to meet municipal needs.

The reason is low flows in the river. Albuquerque is constrained by a 2004 “biological opinion” from the U.S. Fish and Wildlife Service, which requires the municipal utility to shut down to minimize impact on the endangered Rio Grande Silvery Minnow.

The water Albuquerque diverts – when we’re diverting – is half water from our San Juan-Chama Project transbasin diversion (Colorado River water!) and half native water. We then kinda sorta return the native water to the river via the wastewater treatment plant. The idea is that half of it we consumptively use by dumping the Colorado River water on our lawns and trees, while the native water we run down the sink, clean up, and return to the river – an accounting exercise intended to leave the river whole.

The creates a weird bonus in the short run for the river when this happens, because now we pump groundwater to meet all those needs, and then dump some of that into the Rio Grande, thereby increasing the river’s flows in the short run.

Last summer, for a brief period of time, that pumped groundwater/wastewater was the only thing keeping the Rio Grand wet through the southern end of the Albuquerque reach,.

Rio Grande through Albuquerque could dry again this year

River flanked by woods with desert bluff to the left and tiny hot air balloons dotting the sky

Rio Grande in Albuquerque, Aug. 4, 2023. Photo by John Fleck

The Rio Grande, already dry in the San Acacia reach south of Socorro, has begun drying in the Isleta reach south of Albuquerque. And with a record hot dry summer, we could see it dry in Albuquerque again this year, as it did last year for the first time in 40 years.

Via Dani Prokop:

New Mexico’s largest river could dry again through the state’s largest city, for the second time in about forty years, if the monsoons continue to be weak.

“We could see drying in Albuquerque as early as mid-August,” (the USBR’s Carolyn Donnelly) said.

Problem 1 this year is that it’s hot and dry. Problem 2 is that El Vado Reservoir, built in the 1930s to store spring runoff for use at times like this, is under repair. So the stored water that would provide both irrigation and environmental benefits is unavailable.

This morning’s water management notes from the USBR noted 30 miles dry in the San Acacia Reach and a mile of dry riverbed in the Isleta reach.

Flow this morning through Albuquerque was a bit above 300 cubic feet per second. The median for this point in August is ~600 cfs.