New Mexico’s Rio Grande Compact debt is likely to grow; El Vado Dam won’t be fixed for a long while yet; we might see a lot more Middle Rio Grande Valley farmers paid next year to fallow

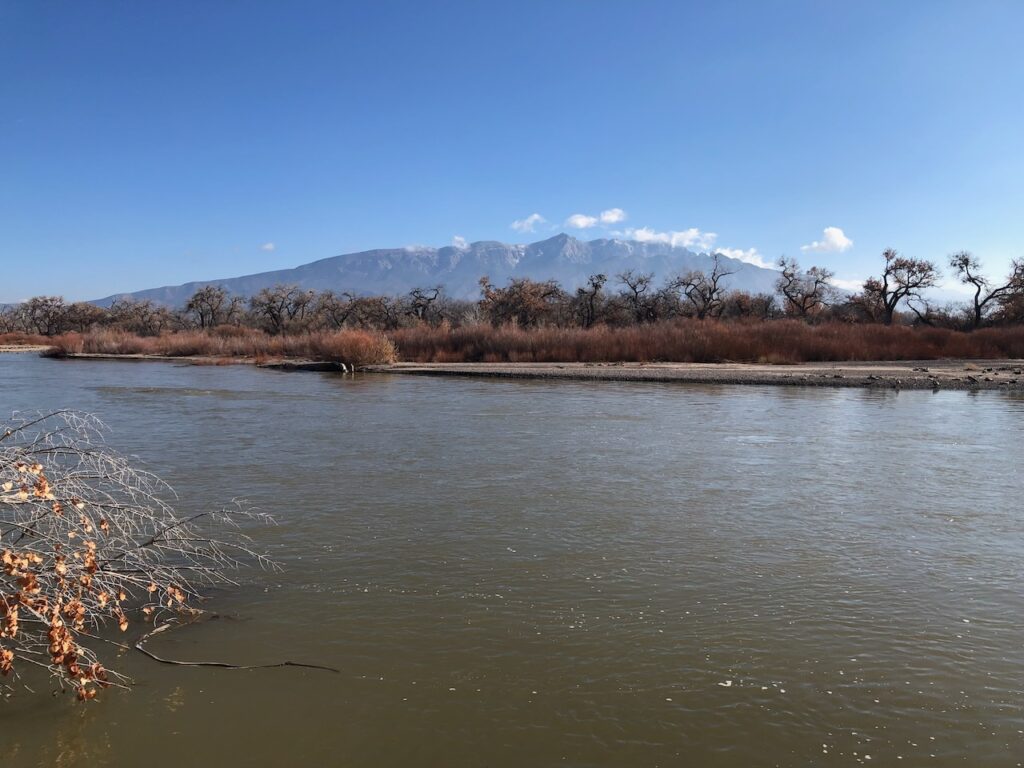
A river with fall colored-trees in the background and a bridge.

Rio Grande at Albuquerque, November 2023

Finishing the new book has thrown me into a time warp.

We’re about to hand in a manuscript for a book that traces a century and a half of the evolution of Albuquerque’s relationship with the Rio Grande, leading up to now. But the now of the act of writing (November 2023) is different from the now that will exist when the book first emerges in 2025, and the now in which readers experience it in the years that follow.

This conceptual muddle is crucial for the book. We are trying to describe the process of becoming that made Albuquerque what it is. That process of becoming, we argue at some length, cannot be understood without understanding how we as a community came together to act collectively to manage our relationship with the river that flows through our midst.

But – and this is the crucial thing, because it explains why we are writing this book – the process of becoming is never done. We hope to help inform Albuquerque’s discussion of what happens next.

There’s less water. What do we do? We will never stop negotiating our complex relationship as a community with the Rio Grande.

I spent a delightful afternoon yesterday that stretched well into the evening, listening to a series of enormously consequential discussions of these issues at the monthly meeting of the board of directors of the Middle Rio Grande Conservancy District. One of the district’s senior folks recently pointed out how often, during the most difficult of discussions, they look at me sitting in the audience and see me grinning. Those most difficult discussions are the most fascinating to me.

I found myself leaning forward in my chair frequently, shifting my position to see the faces of the board members and staff as they wrestled with this stuff.

I grinned a lot.

Three things from yesterday’s meeting stood out. All three are things that would have merited a significant newspaper story back in my Albuquerque Journal days. This blog post is not that, but if you’re paying attention to Middle Valley water you should keep an eye out for these three incredibly important developing issues.

1) New Mexico’s Rio Grande Compact Debt is likely to rise

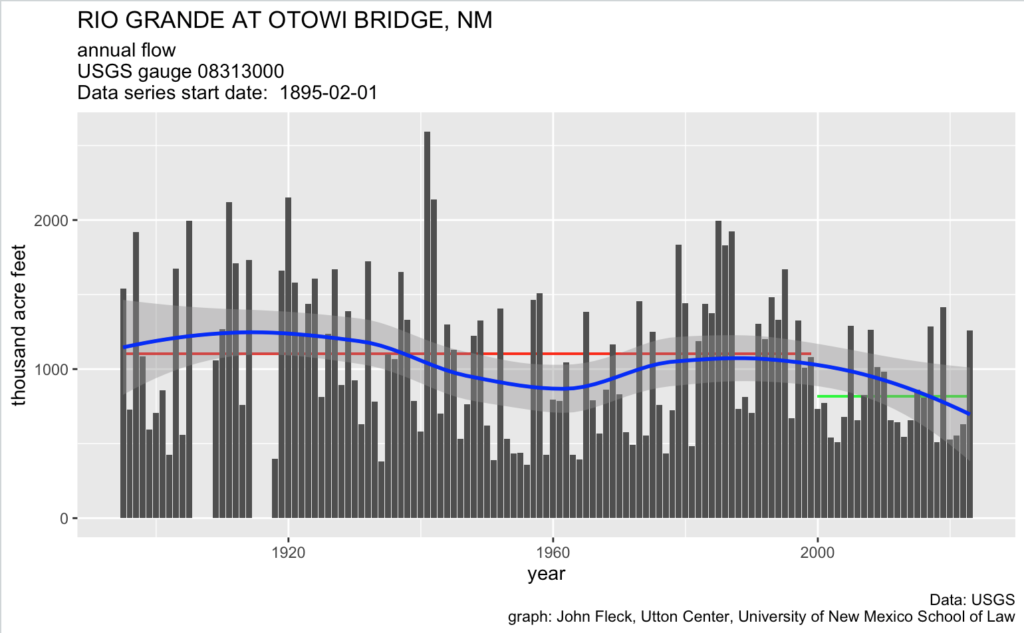
The Rio Grande Compact, an agreement among Colorado, New Mexico, and Texas to share the waters of the compact’s eponymous river, has a tricky sliding formula determining how much water each state is allowed to consume (through human use as well as riparian evapotranspiration), and how much it must pass to its downstream neighbor. It’s got some wiggle room – states can run a debt, as long as it doesn’t get too large and they catch up in subsequent years. But the changing hydrology of the Middle Valley has made it increasingly difficult for New Mexico to meet its downstream delivery obligations.

New Mexico is currently 93,000 acre feet in debt because of under deliveries in recent years. The hole’s likely to get a lot deeper this year, thanks to a big spring runoff (which increases New Mexico’s required deliveries) and a lousy monsoon (good summer rains can help make up a deficit – this year they did not). If our debt rises above 200,000 acre feet, bad things happen.

2) El Vado Dam reconstruction is taking a lot longer than it was supposed to take

El Vado Dam was built in the 1930s to store water for Middle Rio Grande Valley irrigators, allowing storage of spring runoff to stretch the growing season threw summer and into fall. But it’s kinda broken. Contractors working for the US Bureau of Reclamation began work a couple of years ago to fix it, with the expectation that it would take a couple of years. It is now widely understood that it may not be done and in operation again until 2027. Or later.

This would be devastating to the portion of irrigators in the Middle Rio Grande Valley that farm for a living. As our book will deeply argue, it’s critical to understand that this represents a minority of irrigated land in the valley. Much of the farming here is non-commercial, “custom and culture” farming, a supplemental income (or even, for the affluent, a delightful money loser) for people whose livelihood doesn’t depend on it. But for either class of irrigators, a lack of late summer and fall water makes things incredibly hard.

El Vado’s problems have not been publicly announced yet, but all the cool kids are talking about them. Expect something more substantive at December’s MRGCD board meeting.

3) Fallowing

We could see a substantial expansion of acreage fallowed, with a big chunk of federal money paid to irrigators to forego their water in the next few years. MRGCD has been building the institutional widget to do this for several years, with federal money flowing to irrigators to lay off watering their land for either a partial or full season as part of a federally funded program to generate water to meet Endangered Species Act requirements for our beloved Rio Grande silvery minnow. In 2023, that generated (in accounting terms, be skeptical of the four-digit precision) 3,615 acre feet of water.

For 2024, the MRGCD, working with federal money funneled through the state, will push for a dramatic increase. Price per acre will double, to $400 an acre for a split season (irrigate in spring and fall, but not in summer when demand is highest) and $700 an acre for a full season. It’s a voluntary program, so all depends on how much irrigators want to join in, but I can imagine a lot of people looking at the El Vado shitshow and taking the money.

There was a very confusing board discussion that involved an actual invocation of Roberts Rules of Order by the district’s legal counsel and a vote that I still don’t understand with people who support the program voting “no” and people who oppose it (I think) voting “yes”. If I was still a reporter I would have had to sort all of this out while an editor hovered barking about deadlines, but thankfully it’s just a blog that no one actually reads, written by an old guy in pajamas still working on his morning coffee and breakfast.

The bottom line is the possibility of the compensated fallowing of as much as 8,000 acres next year, ~15-ish percent of all irrigated land. I think. As I said it was a pretty confusing thing, and I’m not done with breakfast.


Protecting Reservoir Storage Gains from Water Year 2023: How are we doing?

A guest post by Jack Schmidt of the Utah State University Future of the Colorado River Project.

By Jack Schmidt

A few weeks ago, I posted a perspective demonstrating that we consumed or lost to evaporation the “gains” of Water Year (WY)2011, WY2017, and WY2019 within two years of each of those large runoff events. I cautioned that we should not feel smug about the wet year of WY2023. It is imperative for the Basin States, Tribes, and federal government to agree on ways to significantly reduce basin consumptive uses and losses lest we repeat the past and quickly consume the gains of WY2023. I also suggested that keeping track of the rate at which society consumes the increased reservoir storage from the WY2023 runoff season would be an easily communicated benchmark to track our ability to slow water consumption.

Another month of reservoir storage data are now available from the Bureau of Reclamation. How are we doing in conserving water?

The Details

Decline in reservoir storage occurs when reservoir evaporation and water released from reservoirs to meet consumptive use demands exceed inflows to those reservoirs.

During October 2023, total basin storage declined by 330,000 acre feet (af), of which the combined contents of Lake Powell and Lake Mead declined by 90,000 af. Most of the decline in basin storage was in reservoirs upstream from Lake Powell. To put these numbers into context, 330,000 af is more Colorado River water than the state of Nevada consumes in an entire year.

Since mid-July (when the snowmelt season ended) and 30 October reservoir storage declined by 1.6 million af, of which only 400,000 af was a decline in total storage in Lake Mead and in Lake Powell (Fig. 1). Most of that decline in storage—1.1 million af—was from reservoirs upstream from Lake Powell. To put these numbers into context, 1.6 million af is nearly as much Colorado River water as the states of New Mexico, Utah, and Wyoming have consumed annually, on average, during the 21st century.

The total decline in basin reservoir storage in these 3.5 months has been 20% of the “benefit” of WY2023. Let’s continue to keep track of the rate of decline in reservoir storage, lest we quickly overspend our surplus. Today, the contents of Lake Mead and Lake Powell are about the same as in late-June 2021, and we are far from recovering the system to the nearly full condition that existed in summer 1999. Although the wet year has taken the edge off the looming crisis of critical water shortage, we need to remember our long-term goal—continuing to work hard to conserve the bounty of WY2023.

Water use

Figure 1. Graph showing changes in reservoir storage between 1 January 2023 and 30 October 2023. The lowest reservoir storage occurred in mid-March and storage peaked in mid-July. Since the end of the snowmelt runoff season, storage has been declining. Data assembled from Bureau of Reclamation data.

Phil Isenberg

I had the great good fortune some years ago, when on one of my “learning about water” escapades, this one a visit to the Sacramento-San Joaquin Delta, to have been introduced to Phil Isenberg. Phil – former mayor of Sacramento, and member of the California legislature – devoted much of his life to the pursuit of solving environmental challenges. We stayed in touch over the years (this active blog is a great vehicle for such things), and I learned a great deal from him about the challenge of solving environmental problems in a world of real-world governance constraints.

Most policy-makers, even lesser ones like me, want to find popular solutions to complicated problems. That’s why we spend so much time talking about “win–win” solutions; the dream world where everyone gets whatever they want, and there is no need for taxes or fees to pay for the result! Sure, this is completely unrealistic. We know that.

However, we also know that public expectations— unrealistic or not—permit or block good policy changes.

Phil has been well eulogized – here is one of many. I am sad at the news of his passing.

Water Year 2023 in Context: A Cautionary Tale

A guest post by Jack Schmidt of the Utah State University Future of the Colorado River Project.

By Jack Schmidt

The end of September marked the end of Water Year 2023 (WY2023). This is a good time to take stock of the year’s runoff and to understand how much reservoir storage improved. What kind of a year was WY2023? How long will any added storage last? Can we ease our collective effort to reduce consumptive uses and losses in the basin?

In Summary

The short answer is that WY2023 was certainly a good year for runoff, reservoir inflow, and increases in reservoir storage—but the same amount of inflow would have to occur for several additional years to fully recover storage to what it was in summer 1999 when the system was last full.  Such a string of high flow years has not occurred in the 21st century and is unlikely in the future.

History also warns that we should work to conserve the gains of WY2023. In notably wet WY2011, WY2017, and WY2019, extra storage that accumulated during each year’s snowmelt runoff was totally consumed in approximately two years. Thus, our past shows that there is potential to quickly consume the benefits of a good water year. We’ve done it before. It is imperative to keep a keen eye toward accomplishing significant reductions in water use throughout the basin to save what we have gained. We should not expect Mother Nature to bail us out again.

The Details

Estimates of WY2023 unregulated inflow and natural flow indicate that the year’s runoff was the second largest in the 21st century, exceeded only by WY2011. The Colorado Basin River Forecast Center estimates that the April to July unregulated snowmelt inflow to Lake Powell was 10.6 million acre feet (maf) and that the total unregulated inflow for the year was 13.4 maf. Reclamation estimates that natural flow at Lees Ferry in WY2023 was 17.7 maf (Table 1). Unregulated inflow is the estimated stream flow if little of this year’s runoff had been stored in reservoirs upstream from Lake Powell, and natural flow is the estimated flow at Lees Ferry if there were no reservoirs in the basin and no upstream consumptive uses.

Table 1. Natural flow and total basin consumptive use in the five largest runoff years of
the 21st century. Total basin consumptive use includes reservoir evaporation and use
by Mexico but does not include use in Lower Basin tributaries.

Data concerning reservoir storage are made available by Reclamation at their comprehensive basin-wide hydrologic data base. Daily water storage data are available for 46 reservoirs in the basin including all the large reservoirs and many small ones.


Figure 1 shows how reservoir storage changed during the 21st century. Total storage in all the reservoirs reported in Reclamation’s database is shown in blue, and storage in the three different parts of the watershed are distinguished. Between 60 and 80% of all reservoir storage in the basin occurs in Lake Mead and Lake Powell (orange line). Between 16 and 32% of basin reservoir storage occurs in the many reservoirs upstream from Lake Powell (green line), and between 4 and 8% of basin storage occurs in Lake Mohave and Lake Havasu (red line) that are downstream from Hoover Dam.

Figure 1. Graph showing daily storage contents of reservoirs of the Colorado River basin, as reported by Reclamation, between 1 January 1999 and 30 September 2023. Data do not include reservoirs on Lower Basin tributaries.


The most striking trend in these data is that reservoir storage decreased greatly between August 1999 and October 2004 when total storage decreased by 27.4 maf and storage in Lake Mead and Lake Powell decreased by 24.5 maf. There was a small amount of recovery in storage between October 2004 and August 2019; total basin storage increased by 4.1 maf, and storage in Lake Mead and Lake Powell increased by 0.9 maf. Between August 2019 and March 2023, storage plunged again, decreasing by 14.8 maf in the entire watershed of which 11.4 maf was lost from Lake Mead and Lake Powell. These trends were described in more detail by Schmidt, Yackulic, and Kuhn (2023, The Colorado River water crisis: its origins and the future. WIREs Water).

On 30 September 2023, the total storage in the watershed’s reservoirs was 28.4 maf, of which 62% was in Lake Mead and Lake Powell. The storage in all reservoirs upstream from Lake Powell was 8.6 maf and comprised 30% of the total basin storage. Total basin storage in WY2023 peaked on 13 July at 29.7 maf, and the combined storage in Mead and Powell peaked on 16 July at 18.0 maf (Table 2).

How does this year’s increase in storage compare to increases in other years of large inflow? At the beginning of the WY2023 runoff season in mid-March, total reservoir storage in the basin had dwindled to 21.3 maf (Table 2), which is approximately 18 months of supply, based on the average basin-wide water consumption rate for 2016-2020. The combined storage contents of Lake Mead and Lake Powell was 12.7 maf.

Between mid-March and mid-July, total basin-wide storage increased by 8.4 maf, of which 5.3 maf accumulated in Lake Mead and Lake Powell. In comparison, the other four large runoff years of the 21st century — 2005, 2011, 2017, and 2019 – resulted in increases in basin reservoir storage between 5.2 and 8.8 maf and increases in storage in Lake Mead and Lake Powell between 3.7 and 6.9 maf (Table 2). Not only was WY2023 the second largest runoff year of this century, but reservoir storage increase was also the second largest of the century.

Nevertheless, the increase in reservoir storage in WY2023 was small in comparison to the total loss in storage that had occurred since summer 1999. Between August 1999 and March 2023, the reservoir system lost 38.1 maf, and the increase in storage in WY2023 was only 22% of that amount. It would take another 3 to 6 years of very large runoff to fully recover the basin’s reservoirs to what they had been at the turn of the 21st century.

It is unrealistic to expect that the next several years will be similar to the remarkable winter of 2022-2023. No other high flow year of the 21st century was immediately followed by another high flow year. Our best hope for achieving sustainability in water supply is for the Basin States and the federal government to reach new agreements to greatly reduce basin-wide water use so that the modest recovery in reservoir storage in WY2023 might be preserved. Otherwise, our gains may quickly disappear.

Historical data from the previous wet years of this century provide a cautionary tale about how slowly the political process responds to the opportunity provided by a wet winter. Table 3 summarizes the duration of months it took to consume the increased supply of each of the previous years of large runoff. Half of the supply provided by the largest inflow year of WY2011 was gone 11 to 13 months after peak storage had occurred in early August 2011; 8 to 10 months after that, all of WY2011’s large runoff had been consumed (Table 3). The historical story is the same for WY2017 and WY2019.

Since mid-July when the snowmelt season had ended, reservoir storage has begun to decline. The basin’s reservoirs lost 1.3 maf of storage between mid-July and 30 September of which 0.3 maf was lost from Lake Mead and Lake Powell and 0.9 maf from the reservoirs upstream from Lake Powell. The total consumption in these 2.5 months was 16% of the “benefit” of WY2023. Today, the contents of Lake Mead and Lake Powell are about the same as what they were in mid-June 2021.

A Last Thought

One strategy for maintaining a public focus on water conservation would be to widely report—every month—changes in total reservoir storage. The Basin States, and the basin’s citizens, would benefit from knowing the rate at which we are consuming the bounty of the WY2023 supply. It would be especially useful to know the point in time when we consume half of what we gained this year. If we reach that point in less than a year, we would have fair warning that the political process by which we now seek to reduce water consumption is too slow. Hope for a secure and sustainable water supply must rely on nimble and adaptable strategies for reducing water consumption and saving the gains of each wet year.

f/8 and be there

Dawn over Albuquerque’s Rio Grande, Oct. 23, 2023. By John Fleck

I got up early today, threw a camera and a bike in the car, and headed down to the Rio Grande.

There’s a spot south of downtown I discovered last month where, when the river’s low, you can get out on the sand flats and look up to see downtown, rising above the river bed.

I just had a phone camera with me when I found it, so I’ve been meaning to get back. With flows about to jump up as river managers move water currently sitting behind upstream dams, I’m about to lose my chance to get a picture I really want for the book.

It’s a couple of miles down the levee from the Barelas Bridge, at a gap in the bosque along a power line. It can be hard to get to the river sometimes because of the heavily anchored treelines along the banks, but power lines usually have a path.

f/8 and be there

It’s apparently not at all clear that the famous New York street photographer Arthur Fellig actually coined the phrase “f/8 and be there”, but it’s too good not to tell the story that way, so it’s stuck.

Fellig – “Weegee” – would almost supernaturally show up at the scene of chaos (hence “Weegee” after the “Ouija board”).

In Weegee’s day, photographers had to master tricky manual settings on their camera. In my childhood, I remember dad’s light meter, and the fiddling with the camera’s f stops – essentially the size of the shutter opening – and shutter speeds.

Dad was an artist, working at a different pace that a street photographer like Weegee, with his Speed Graphic and flashbulbs. f/8 is a mid-range aperture setting that’s pretty forgiving, and gives you a decent shot under a variety of conditions.

But it’s not so much the “f/8” that matters here. It’s the second part – “and be there”. As I explained when describing one of my favorite book-writing escapades….

One of my journalistic techniques is to try to put myself in a place where something interesting is likely to happen, something real, and then wait.

I’ve been around photography my whole life. My dad, an artist, learned photography from the Army during World War II, and always had cameras. The photography itself wasn’t his art, it was a tool to capture imagery doing aesthetic work on his behalf. My wife, Lissa, also an artist, has always had cameras, always used photographs to make art.

From the beginning of my newspaper career, I worked with photojournalists, offloading the visual insights to a professional. But I always preferred going out with the shooter, not just sending them to take pictures. The photos and the words worked best when they worked closely together.

Toward the end of my career, I started shooting my own pictures, and it’s given me great joy. I’m not great at it – I know having lived and worked with terrific photographers. But I’m cool with my own mediocrity.

It’s the “be there” part. Camera technology today is so forgiving that you don’t need to think much about the “f/8” part, but the “and be there” is a conceptual joy.

I’m writing a book about a city and a river. It’s hard to fit those two things in a single frame. When I walked out in the river bed last month, looked upstream, and saw Albuquerque’s icononic pointy buildings poking up over the river bed, I had the “kaching” that comes from being there.

I don’t think the shots I got this morning quite work yet. But I can always go back!

A Bureaucratic Palimpsest

The Conservancy Act as an old-timey bureaucratic palimpsest. DALL-E 3

I emerged this morning from a month (Six weeks? Two months? I’ve lost track of time.) of writing about the crucial period from 1918-ish to 1931-ish in Albuquerque’s relationship with the Rio Grande.

The period right now takes up four chapters of Ribbons of Green, the book Bob Berrens and I are writing, which is more than we had intended, but in retrospect it seems inevitable.

The railroad changed everything when it arrived in 1880. But change came slowly, as Albuquerque’s leaders bent on building a big American city struggled to solve the collective action problem of managing our relationship with the Rio Grande – especially the provision of drainage (the valley floor where we wanted to build a city was muchly a swamp!) and flood control. Their attempts were caught between competing visions of community identity and values – progressive boosters (mostly but not entirely Anglo) pressing for progressive-era “scientific management” and deeply embedded communities of Hispanic farmers with a lot of “WTF, this isn’t going to work, why are you making me pay for it!” Off to one side stood the indigenous Pueblo communities, fiercely protecting their sovereignty but with a realpolitik born of three centuries’ experience of struggle against colonization.

The clash shaped the contentious birth of the institution created to realize the dream of building a modern city on the valley floor – the Middle Rio Grande Conservancy District. The District’s turbulent origins marked a pivotal point where Albuquerque leaned fully toward the future, embracing both the benefits and costs of trying to engineer its relationship with the Rio Grande. The period has been written about before – Kenneth Orona’s River of culture, river of power : identity, modernism, and contest in the Middle Rio Grande Valley is terrific – but not in the way that we needed. (If this had already been done, there would be no point to Bob and I spending all of this time writing a book, besides how terrifically fun it’s been. Which I suppose is reason enough?)

The period occupies a huge portion of our book because it laid down the institutional foundations of the modern city of Albuquerque’s relationship with the Rio Grande – and in so doing, the institutional foundations of the community itself. But those foundations are obscured by the stuff that came after.

Our exercise was twofold. First, we had to examine what we all (the community of people who ponder such things) think we know about that history. Second, we had to examine the traces of that history found underlying our modern world.

Explaining it as this simple two-step process is a necessary but imperfect description, because it’s a two-way thing. Our understanding of the present informs how we research the past, and our research of the past in turn informs how we re-think the present. Add in the complexity of two thinkers looking at this (Bob and me) and understand it as a tangled process, without clear beginning or end points.

All of that has left traces on the relationship between our modern city and the Rio Grande.

A Bureaucratic Palimpsest

I was talking with a friend about this. “Ah, the old bureaucratic palimpsest!” my friend said.

I admitted ignorance, not knowing what to do with “palimpsest”.

My friend offered a combination of sheepish humility and delight at their use of a liberal arts education.

“A ‘palimpsest'”, they explained, and I paraphrase while quoting “is an object (often a manuscript) that has been written on multiple times, so that the previous layers of writing can still be seen or detected underneath the current layer. So a ‘bureaucratic palimpsest’ would be like the accretion of rules and regulations, layered on top of each other over time, each layer reflecting a different set of priorities or values. It’s a messy, but fascinating, process to try to untangle.”

Messy but fascinating indeed. I’m having the time of my life.


The Upper Colorado River Basin Compact at 75

Editor’s note: Today (Oct. 11, 2023) is the 75th anniversary of the signing of the Upper Colorado River Basin Compact. The following is an excerpt from Revisiting the Upper Colorado River Basin Compact on its Diamond Anniversary, a forthcoming analysis by Eric Kuhn and John Fleck, co-authors of the book Science Be Dammed: How Ignoring Inconvenient Science Drained the Colorado River.

By Eric Kuhn and John Fleck

The Upper Colorado River Basin Compact was signed by representatives from Arizona, Colorado, New Mexico, Utah, and Wyoming on October 11, 1948, after over two years of negotiations. It was an attempt to resolve the allocation of water among the five states, and for three quarters of a century it performed that task well.

But as we approach the middle of the third decade of the 21st century, the challenges of overallocation of Colorado River, over-appropriation of the water we have, and climate change reducing the river’s flows, the Upper Basin Compact and the extended body of rules in which it is embedded are showing their age.

At its simplest, the Upper Basin Compact divided the water use available from the 7.5 million acre-feet per year apportioned to the Upper Basin by the 1922 Colorado River Compact. The compact accomplished two major tasks:

  • It apportioned the consumptive use of water among the Upper Basin states using percentage allocations. Colorado received 51.75%, New Mexico 11.25%, Utah 23%, and Wyoming 14% of the water available for use in the Upper Basin. Arizona received a fixed 50,000 acre-feet per year.
  • It defined the obligations of the Upper Division states (Colorado, New Mexico, Utah, and Wyoming) to deliver water to the Lower Basin at Lee Ferry to satisfy the requirements of the Colorado River Compact.

In pursuing a new set of post-2026 Colorado River Operating rules, major water agencies and state leaders have insisted that the “Law of the River” – the suite of rules dating to the 1922 Colorado River Compact and including the Upper Basin Compact – should be a fundamental guiding principle of future river management. “The Post-2026 Operations should reside in a framework consistent with a reasonable interpretation of the Law of the River,” the Central Arizona Project wrote, to cite one example among many.[1] But a careful review of the history of the Upper Basin Compact shows how tenuous a foundation the Law of the River provides, and how uncertain any attempt at “reasonable interpretation” might be, because of fundamental uncertainties about what the Law actually says.

  • When the Upper Basin compact was signed there was agreement on the definition of the “what” to which the percentage allocations apply. Water use in the Upper Basin was limited by water availability after meeting the Colorado River Compact’s Lee Ferry delivery requirements. Today, because of the impacts of climate change on flows, there is no such agreement and there are claims that the intent of the compact was to provide an equal amount of water for use to each basin. This creates deep uncertainty in the actual volumes of water available to each state.
  • There is still no consensus on how to measure consumptive use basin-wide. The Upper and Lower Basins use different methods, and Lower Basin tributary use is neither well understood nor quantified. This makes managing the river system challenging.
  • The Upper Division States claim overuse by the Lower Basin based by using one measurement method, while using a different method for their own uses. There is valid dispute over these theories and methodologies.
  • Tribal water rights remain unresolved and limited in some cases by provisions aimed at preventing tribes from using their full legal entitlements.

In negotiating the Upper Basin Compact, the states made key decisions on critical compact issues that continue to echo through 21st century water management.

Stream Depletion

Colorado River management has always suffered under controversy and ambiguity around the question of how to measure consumptive use. The Colorado River Compact did not include a definition of “beneficial consumptive use.” In the century since it was signed, two competing (and conflicting) methods have been used: diversions less return flow, and stream depletion. On some scales, they may look the same. But on large enough scales, they do not, in ways that have profound implications for 21st century river management decisions.

Under the stream depletion theory, each basin’s consumptive use is measured as the net reduction in natural flows caused by man-made activities. For example, the Upper Basin’s consumptive use would be calculated as the amount that upstream uses deplete the natural flow of the river at Lee Ferry.

During the Upper Basin Compact negotiations, Colorado and Arizona were the main proponents of this theory. It was ultimately adopted in Article VI of the Upper Basin compact as the method for measuring consumptive use.

But the stream depletion theory is not universally used in river management today. It is, for example, used to quantify reservoir evaporation in the Upper Basin, but not the Lower Basin. It is not used to measure Lower Basin mainstream uses, where the “diversions minus return flows” method is used instead. Uses on the Lower Basin tributaries, which are included in the compact definition of “Colorado River System” are currently not measured at all – using either theory.

So, while the stream depletion theory survives in the Upper Basin Compact, inconsistencies and lack of measurement means there is still no consensus on how to quantify consumptive use basin-wide under the Law of the River. This remains a source of conflict and uncertainty and if not corrected or finessed could lead to interstate litigation among the compact states.

Allocating state water by percentages rather than absolute amount

The Upper Basin Compact is frequently praised for state-by-state allocations based on percentages (except Arizona), rather than absolute numbers, thus avoiding the mistake in the Colorado River Compact that over-allocated the river’s water.

But modern policy discussions are unsettled on a central issue – percentage of what? On their own, the percentages are meaningless without reference to some sort of underlying total amount of water available to be shared among the states.

When negotiating the Upper Basin Compact, the states’ representatives were clear on what they intended as the basis for using the percentages. They intended to apply the percentages to the amount of water available for consumptive use in the Upper Basin after meeting what they viewed as their compact “delivery obligations” at Lee Ferry.

Today, there is no such consensus. Climate change has altered the river’s hydrology, putting the burden of impacts on the Upper Basin. Its leaders have responded by arguing that the compact’s negotiator’s intention was to equally divide the water available to each basin for use. Since climate change is causing a decline in natural flows, whatever Lee Ferry obligations the Upper Division States have must now be adjusted to reflect the new hydrologic reality.

Resolving this issue requires either litigation, negotiated settlement, or collectively agreeing on a modified approach – one that appropriately factors in climate change and maintains the benefits of the 1948 flexible percentage allocations.

Tribal Water

While large Native American water needs and legal entitlements were identified before the Upper Basin Compact was negotiated, Tribal communities were excluded from the negotiations. Instead, Indian water use, which the negotiators knew was legally perfected long before 1922, was lumped into state allocations, with each state being responsible for meeting tribal needs from its share of the water. This gamble set up a potential conflict between the apportionments made by the Upper Basin Compact and the protections provided Indian rights under the Colorado River Compact.

A decade after the compact was signed, this conflict became real. In response, Upper Basin leaders took steps to limit tribal water rights and prevent full use of tribal entitlements, by inserting provisions in project authorizing legislation. The implications today are a legacy of intentional discrimination against tribes, unresolved legal questions around tribal water rights, and provisions that treat Native Americans as second-class citizens.

[1] Brenda Burman letter to Bureau of Reclamation, Aug. 15, 2023. See also comments by the state of Wyoming, the Salt River Project, the state of Colorado and the Upper Colorado River Commission.

Riding everywhere

Completing my Albuquerque map

Today’s bike ride was a milestone.

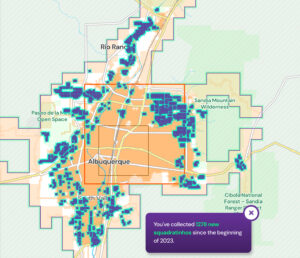
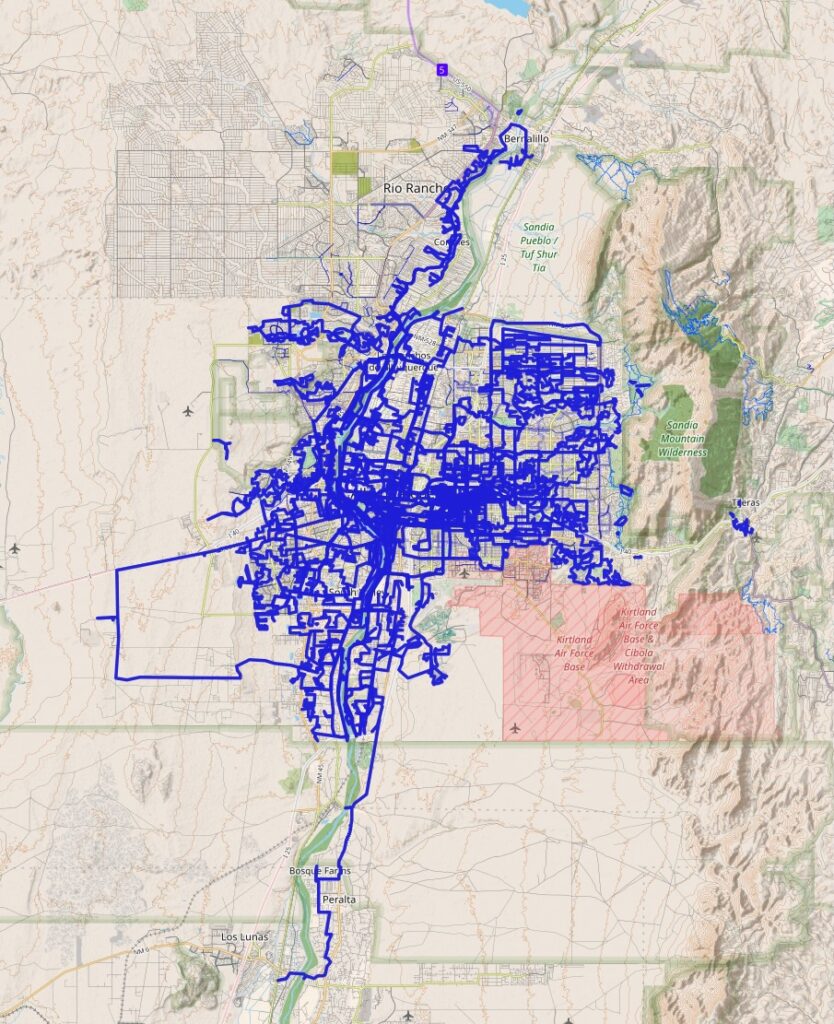
Riding out to a neighborhood called Ventana Ranch in Albuquerque’s far northwest corner completed the last “tile” (think bingo squares) in my map of the city’s urbanized area.

In this case the tiles are a bit more than a mile on a side (“Zoom Level 14” for the map nerds). This means riding my bike (or any other self-powered travel – walking, hiking, kayaking, etc.) with a gps track running through each and every square mile of the city.

If you increase the “Zoom level” the tiles get smaller – 15 is a bit more than half a mile, 16 is ~a quarter mile, etc. – so the map isn’t done yet. Here it is at Zoom level 17, which at less than a quarter mile for each tile is much more challenging:

At Zoom level 17, golf courses present a challenge.


There’s still a lot to do in the far northeast and northwest and in the far southeast valley, places that are a) farther from home, b) less interesting, and/or c) tricky because of large rich people properties, fences, etc. There are some big gorgeous horse farms in the South Valley that remain a challenge, for example.

Gated communities are a challenge at this scale, but not insurmountable. Gates eventually have to open, right? (The obvious corollary is that they also close, adding to the challenge.)

It’s easy to mistake a golf cart path for a bike path, but the paths’ use for tiling is frowned on by course stewards, so golf courses remain a challenge as well. There are some things with legit fences – the water treatment plant, an electric generating plant, a Cheerio factory (?) – that we’ll probably never get into, but I did find my way one time into a hazardous waste dump on the north end of town!

The big tiles were pretty easy to get to – I just had to ride everywhere, which took a lot of time. The smaller tiles are where the fun is.

My tiling is modest compared to the serious tilers you can find at Ride Every Tile, one of the web homes for the game. Jonathan France’s map of southeast England is epic.

Riding everywhere, Wandrer style.

There’s a related game called Wandrer that tracks every street you’ve ridden. The map above is so congested that it looks like I’ve ridden everywhere, and in the heart of town where I live I mostly have. But there’s still lots to do. I’ve ridden 1,765 unique miles of the city of Albuquerque’s 2,999.9 miles of streets and paths, as represented in Open Street Map, and 2,276.1 unique miles of Bernalillo County’s 5,446. This is a game that’ll go on forever! But it gets harder and harder to get new miles – I’ve already ridden most everything in range of my day-to-day riding.

I used to have a personal preference to ride from home when tiling/Wandring, but as I get older and my range shrinks, the rule’s relaxed. Wandrer is OK with e-bikes, so my new pedal assist e-bike has extended my range for that. But tiling is human-powered only, so I’ll drive to a new part of town for rides to get tiles now.

I always rode with a “What happens if we turn here?” mindset. I discovered the games during my epic pandemic cycling year of 2020, and it added a fun cognitive layer.

All of this is made possible by cheap GPS gizmos (I use a Garmin watch and a Karoo bike computer), and a software pipeline put together by a combination of hobbyists and indie developers building inexpensive platforms to upload the data and make the maps.

Thinking about the Rio Grande, remembering history

Heron with jetty jacks, Rio Grande, Albuquerque, September 27, 2023, photo by John Fleck

Apologies for the pixelated image. I just had the phone, not a camera, and the great blue heron flew before I could get close enough to get a good shot.

I got to the river just as the sun crested the Sandias this morning, and the light was gorgeous.

I’m giving a kinda important talk tomorrow, at a luncheon commemorating the 100th anniversary of New Mexico’s Conservancy Act. It’s a law that changed Albuquerque’s relationship with the Rio Grande, and in a weird sort of way you can see the results of the law in the picture.

The book Bob Berrens and I are writing, Ribbons of Green: The Rio Grande and the Making of a Modern American City (spring 2025, UNM Press), is about how rules change landscapes. The rule in question is the 1923 Conservancy Act, which created the legal framework needed to create what became the Middle Rio Grande Conservancy District. The 1923 statute said this:

[A]ny district so established shall have the power to straighten, widen, deepen, divert or change the course or terminus of any natural or artificial water course.

The Conservancy District is gearing up to commemorate its centennial, and knowing of our book project, the district invited me to give the keynote at the kickoff luncheon tomorrow.

Resting up for the big talk (these things are strenuous!) I took the morning off from working on the book, threw a bike in the car, and headed down to the river before sunup. The neighborhood joggers were out enjoying the cool riverside air as I wandered the maze of singletrack through the woods upstream from the freeway bridge.

Again, the quality of my picture isn’t great. I need to go back with the big camera. But if you look beyond the charismatic fauna to the far bank, you’ll see those big crossed steel contraptions that look like giant jacks (the kids’ toy). They were installed in the 1950s by the U.S. Bureau of Reclamation as part of the river management project that began with the Conservancy Act 30 years before.

Bosque singletrack at sunup, Albuquerque, NM, Sept. 27, 2023, picture by John Fleck

In the 1920s, when the New Mexico state legislature approved the first Conservancy Act, Albuquerque was struggling to build a city on a flood plain that had grown increasingly waterlogged. We think of the Conservancy District today as an irrigation agency, but the statute that midwifed its birth barely gives irrigation a mention. It was all about (quoting the original statute here):


  • Preventing floods;
  • Regulating stream channels by changing, widening and deepening the same;
  • Regulating the flow of streams;
  • Diverting, controlling, or in whole or in part eliminating water courses;
  • Reclaiming, draining, or filling wet and overflowed lands….

Irrigation is there in the first statute if you look hard enough for it, in a section headed “incident to such purposes” – in other words, if along the way to meeting the above goals you feel a need to do some irrigation too, cool, go for it! (Also totally OK: hydropower.)

A series of statutory innovations followed, at both the state and federal level, so it’s a crooked, broken path to the jetty jacks in the 1950s, but if you look hard it’s there. Their purpose was to slow water along the river’s edges so sediment would drop out and build new banklines like you see in the background of the picture above. Up out of the channel, lines of jetty jacks created moist beds of sediment that were ideal for baby cottonwoods. The Rio Grande bosque, a ribbon of cottonwoods more than a hundred miles long, is the result.

The bosque wasn’t intentional. This was all about water management. But you couldn’t have built a better city park if you tried, had meant to.

Resting up for tomorrow’s big talk (these things are strenuous!) I took the morning off from working on the book, threw a bike in the car, and headed down to the river before sunup. The neighborhood joggers were out enjoying the cool riverside air as I wandered up the maze of singletrack through the woods upstream from the freeway bridge.

The river’s low right now, but as I walked out onto sandbars in what the mapping apps color river blue, the birds were enjoying what water there was.


Deadpool Diaries: Lower Basin use on track to be lowest in nearly four decades

Projected Lower Colorado River Basin water use, as a percentage of each state’s total allocation


I’ve emerged from my cozy book writing cave (The new book’s going well, thanks for asking!) to some stunningly optimistic Lower Colorado River Basin water use data.

Forecast use in 2023 (based on the Sept. 18 USBR forecast model) has dropped below 6 million acre feet, currently just 79 percent of the total baseline Lower Basin allocation of 7.5 million acre feet. Californians are on track for their lowest take on the river since 1949, according to my crazy stitched-together dataset (USBR decree accounting reports plus pre-1964 numbers assembled some time ago by some folks at MWD).

Arizona and Nevada’s use is the lowest its been since 1992.

Relative to their baseline allocations, Arizona (at 69 percent) and Nevada (at 65 percent) are still doing the heaviest lifting, but California (at 86 percent) is seriously pitching in too.

State/Total 2023 Use (acre-feet) % of Total Allocation Last Year Use Was This Low
Arizona 1,921,944 68.64% 1992
California 3,788,609 86.10% 1949
Nevada 193,599 64.53% 1992
Total US Lower Basin 5,904,152 78.72% 1984


Because bits are cheap, here’s the full dataset back to 1964. Source is the USBR’s Water Accounting reports, with a huge thanks to Sami Guetz at UCSD for help earlier this year QA’ing the numbers:

year Arizona California Nevada total
1964 1,127,176 5,064,733 25,297 6,217,206
1965 1,008,531 4,899,987 22,716 5,931,234
1966 1,073,055 5,096,912 26,656 6,196,623
1967 1,106,894 4,886,734 27,190 6,020,818
1968 1,169,240 5,072,533 33,614 6,275,387
1969 1,138,085 4,896,527 37,392 6,072,004
1970 1,201,441 5,015,018 38,308 6,254,767
1971 1,296,930 5,216,300 50,586 6,563,816
1972 1,203,043 5,230,635 81,051 6,514,729
1973 1,268,744 5,317,547 92,649 6,678,940
1974 1,325,631 5,414,040 94,889 6,834,560
1975 1,358,003 4,983,705 72,140 6,413,848
1976 1,248,020 4,706,594 73,192 6,027,806
1977 1,231,274 5,097,343 73,174 6,401,791
1978 1,234,942 4,503,340 71,293 5,809,575
1979 1,150,853 4,788,423 60,074 5,999,350
1980 1,169,657 4,725,496 92,426 5,987,579
1981 1,415,850 4,795,949 110,017 6,321,816
1982 1,240,384 4,299,799 102,326 5,642,509
1983 1,062,169 4,245,045 86,596 5,393,810
1984 1,122,399 4,677,103 101,492 5,900,994
1985 1,194,208 4,778,749 101,709 6,074,666
1986 1,356,930 4,803,676 112,217 6,272,823
1987 1,734,172 4,891,961 108,863 6,734,996
1988 1,922,737 5,039,679 129,420 7,091,836
1989 2,229,967 5,144,417 156,213 7,530,597
1990 2,260,272 5,219,457 178,111 7,657,840
1991 1,864,360 5,005,595 180,224 7,050,179
1992 1,906,071 4,546,192 177,551 6,629,814
1993 2,246,695 4,835,017 204,402 7,286,114
1994 2,152,410 5,234,088 227,542 7,614,040
1995 2,221,346 4,925,480 217,439 7,364,265
1996 2,714,754 5,322,652 249,248 8,286,654
1997 2,853,886 5,250,119 242,777 8,346,782
1998 2,566,707 5,045,228 245,303 7,857,238
1999 2,727,960 5,194,380 291,130 8,213,470
2000 2,802,758 5,162,211 321,984 8,286,953
2001 2,841,028 5,254,718 315,429 8,411,175
2002 2,969,230 5,365,609 326,718 8,661,557
2003 2,830,599 4,408,746 298,392 7,537,737
2004 2,784,645 4,316,185 283,006 7,383,836
2005 2,428,469 4,344,258 291,778 7,064,505
2006 2,782,866 4,335,299 292,864 7,411,029
2007 2,783,323 4,370,695 300,312 7,454,330
2008 2,752,497 4,498,810 269,654 7,520,961
2009 2,831,711 4,358,074 248,613 7,438,398
2010 2,780,367 4,356,839 241,437 7,378,643
2011 2,781,108 4,312,661 222,847 7,316,616
2012 2,789,667 4,416,718 237,161 7,443,546
2013 2,778,867 4,475,789 223,563 7,478,219
2014 2,774,661 4,649,734 224,616 7,649,011
2015 2,604,732 4,620,756 222,729 7,448,217
2016 2,612,833 4,381,101 238,326 7,232,260
2017 2,509,503 4,026,515 243,425 6,779,443
2018 2,632,260 4,265,525 244,103 7,141,888
2019 2,491,707 3,840,686 233,996 6,566,389
2020 2,470,776 4,059,911 255,568 6,786,255
2021 2,425,736 4,404,727 242,168 7,072,631
2022 2,014,176 4,445,255 223,670 6,683,101
2023 1,921,944 3,788,609 193,599 5,904,152