tl;dr Vegas is an easy target, but Lake Mead’s problems involve far more than Sin City’s profligacy.

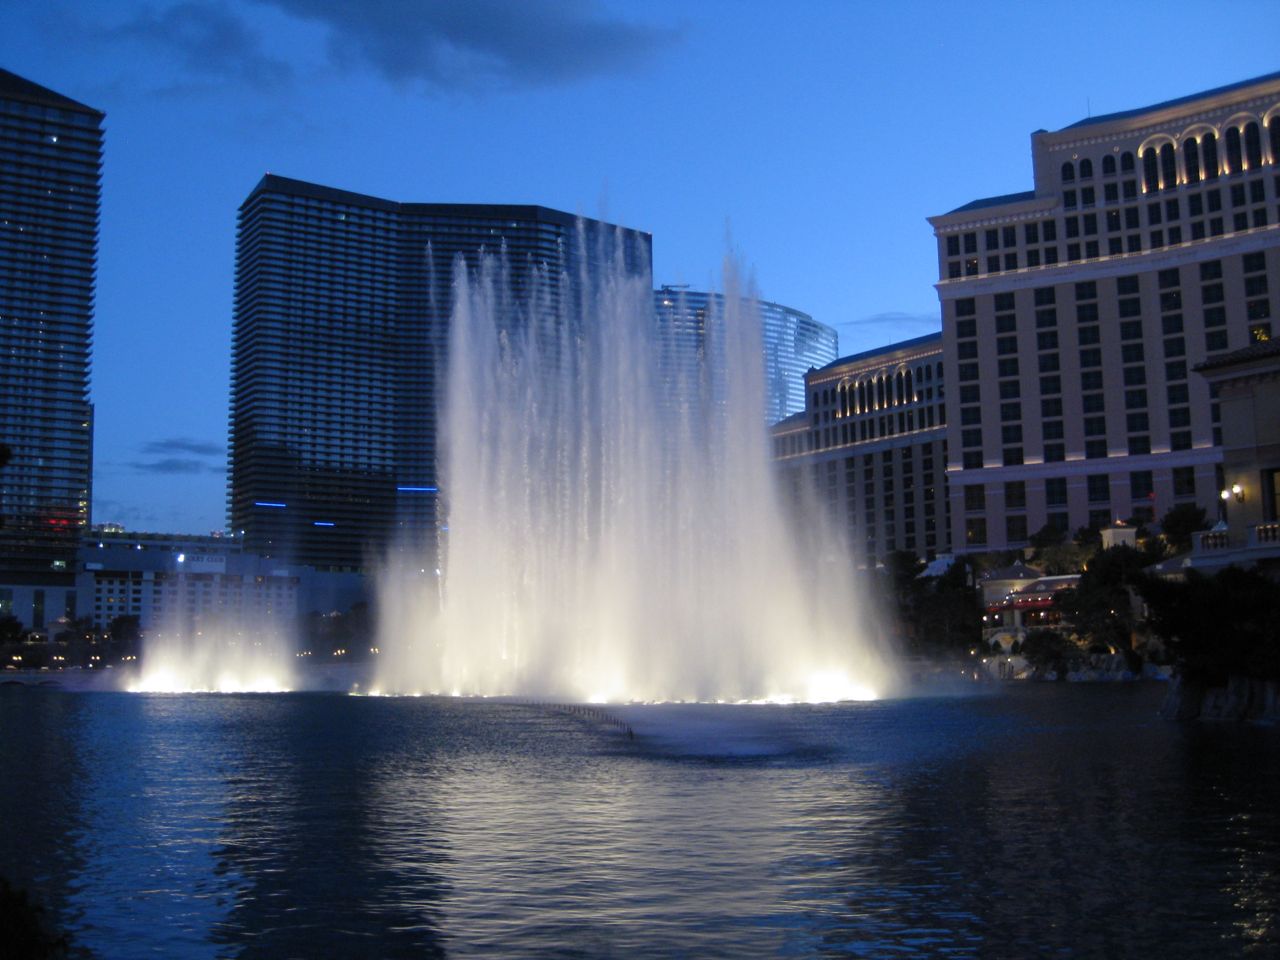
Bellagio Fountain, Las Vegas NV
: As Lake Mead drops toward a record low some time next month, there’s a temptation to draw a dotted line to the Bellagio Fountain, 30 miles to the west, and point a finger of blame. It’s not the fountain itself, but rather the water excess of Las Vegas that it symbolizes, that draws the easy comparison, as the energetic and extremely widely read Eric Holthaus did in
a recent Slate post that tripped straight from Mead’s record lows to the gaudy fountain on the strip:
If it wasn’t used to water lawns or wow tourists at the Bellagio, it could be used for drinking.
And this is true, but it misses the crucial point embedded deep within the arithmetic underlying Lower Colorado River Basin’s water balance sheet. The question of whether Las Vegas’s water use is unnecessarily profligate is an important one, but it’s of only marginal importance when talking about the risk the Southern Nevada city faces.
Las Vegas could do a dramatically better job of conserving water – shut down the fountains, get rid of the lawns – and still see Lake Mead drop uselessly from beneath its feet. Here’s a graph of how we use Lower Colorado River Basin water that may help explain this:
The blue bars are 2013 consumptive use by the nine largest water users in the lower basin. The orange bar that I snuck in there for comparison is what we’ve been lately calling the “structural deficit” – the excess water used in the lower basin above and beyond the full annual normal year allocation. Southern Nevada – essentially the greater Las Vegas metro area – consumed 223,563 acre feet of water. (source – pdf) Las Vegas could cut its Colorado River water use to zero – blow up all those casinos and leave Vegas to desert dust – and Lake Mead’s structural deficit would still be close to a million acre feet a year.
Look again at the big bars in the chart above. Have you heard of the Wellton-Mohawk Irrigation District? It uses more water than Vegas. Coachella? In addition to some sort of hipster music festival every year, they also use water to farm the desert – more water than Vegas uses to harvest tourist dollars. You’ve of course heard of the Imperial Irrigation District. It uses ten times as much water as Vegas.
I’m not here to defend Las Vegas’s water use. Could they do more to conserve? Absolutely. There’s a serious conversation to be had about that city’s approach to life in the desert. They will have to be to be part of the solution to Lake Mead’s problems. But until the broad societal conversation embraces all the water users, rather than wagging an accusing finger at the Bellagio Fountain, we’re not going to get anywhere in dealing with this problem.
a note on the data: The numbers in the graph are total consumptive water use, as reported in the U.S. Bureau of Reclamation’s 2013 Colorado River Accounting and Water Use Report for Arizona, California, and Nevada (pdf). The numbers represent all large water users in the Lower Colorado River Basin, those whose water is drawn from Lake Mead. These users account for 95 percent of the U.S. Lower Colorado River Basin consumption. The rest is scattered among a bunch of much smaller users, which I was too lazy to graph, plus it would have been too wide. A number of the users shown, including Las Vegas and the Colorado River Indian Tribes, withdraw more water than shown from the river, but then put some back. The numbers in the bar chart represent the net of those two numbers, what in the jargon is called “consumptive use”. For several, including Yuma County ag, I’ve lumped more than one water user into a single bar.