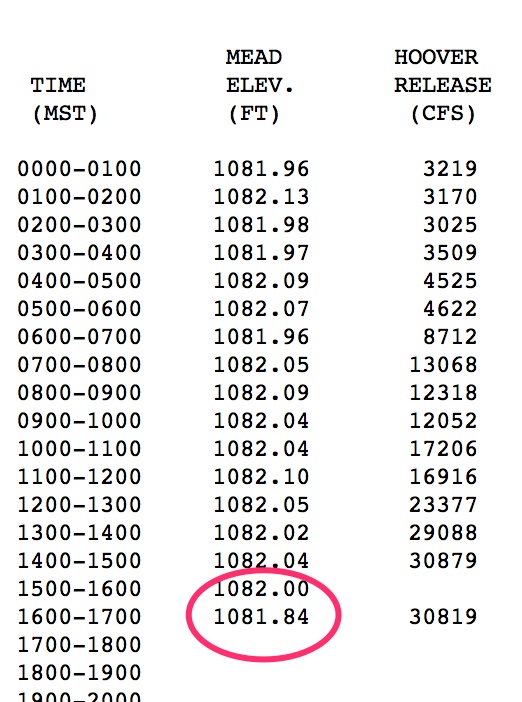
update: With the latest hourly reading, the elevation of Lake Mead has dropped to 1,081.84 feet above sea level, the lowest it has been since the reservoir was being filled in the 1930s:
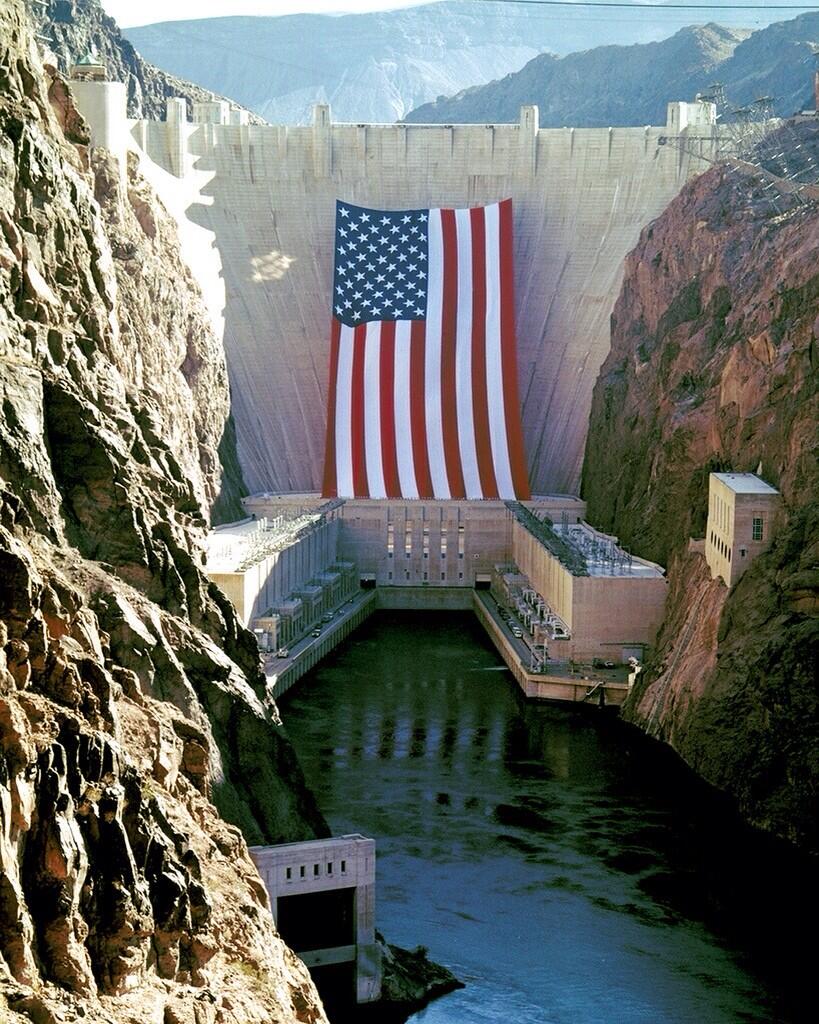
With apologies to Emily Green, Lake Mead – Low Bad
Previously: Last night at midnight, the surface elevation of Lake Mead dropped to 1,081.89 feet above sea level, half an inch above the previous record low of 1,081.85 set around 9 p.m. Nov. 27, 2010 (source pdf). There’s a certain ebbing and flowing as water flows in from upstream and flows out to run turbines and water downstream farms, so I can’t say with precision when we’ll break the old mark, but by some time tonight or early tomorrow, it’s likely to drop past the record.
This already generating a lot of attention, and is likely to generate more as the record is set. (I had to wait in line this morning behind a TV station when I wanted to talk to one of the key basin water managers. I am not in a hurry. I am writing a book, which has a looser deadline.)
One of the truisms you will likely hear is that the drought since 2000, which has contributed to Mead’s decline, is unprecedented, outside of the historical record and therefore something water managers could not have been expected to plan for. But I recently ran across an interesting graph from the Bureau of Reclamation that suggests that may not be quite right. If we take the estimated river flows of the drought conditions that spread across the Colorado River Basin in the 1930s and early 1940 and overlay them atop a 21st-century water management system, Lake Mead would actually drop faster than it is today.
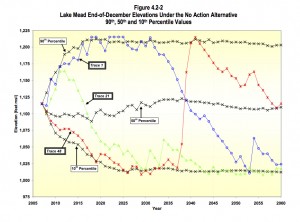
Simulated Lake Mead levels, courtesy USBR
Take a look at the blue line and circles in the graph to the right labeled “Trace 1”. (Click to blow it up if you need to, I can wait.)
This is from the 2007 Final Environmental Impact Statement for the Colorado River Interim Guidelines for Lower Basin Shortages and Coordinated Operations for Lakes Powell and Mead. (source) The hydrologists created a series of synthetic data series and plugged them into a modern river system operational model – dams, water users and all – to see what would happen to Lake Mead in the future under various inflow scenarios.
Look at how that blue “Trace 1” line crashes beginning in 2031. That is a simulation of what would happen to Lake Mead if the drought of the 1930s-1950s was repeated in the 21st century. Under that scenario, it takes Lake Mead 14 years to drop from full to a surface elevation of 1,075. The current best estimates are that we could hit 1,075 in 2015 (source pdf), 15 years after it was last fullish in 2000. But what’s got to be unnerving if you’re a water manager is what happens to Trace 1 after it hits 1075. Under that historical hydrology, Lake Mead kept dropping for nearly a decade.
So what’s happening now is essentially equal to, but perhaps not worse, than, the worst case in the historical record.
Caveat: Here’s where the apples and oranges mix. The “Trace 1” scenario, in addition to taking the historical hydrology, presumes some expansion of water use in the future. So by 2031, when Trace 1 begins its crash, there is perhaps ~250,000 acre feet of additional water use in the Upper Basin that is included in the model.