Seen on my bike ride this morning, Albuquerque’s Tumbleweed Snowman in preparation in the back lot behind the flood control authority offices and workshop:
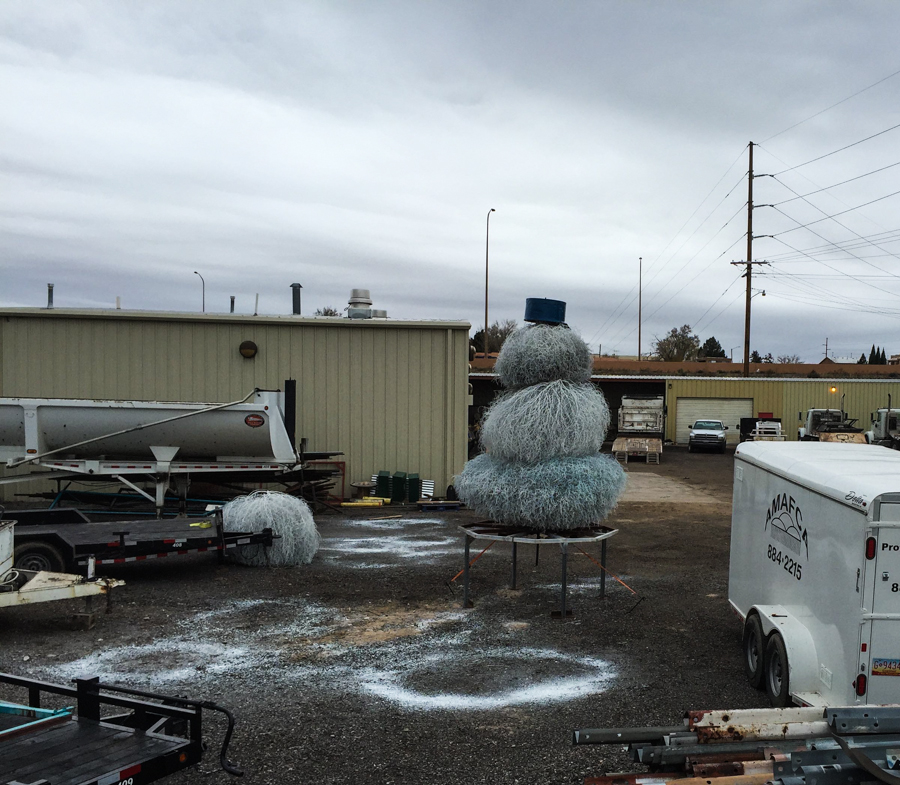
Tumbleweed Snowman under construction, November 2015
Tumbleweed Snowman history
Some years ago I got the help of retiring Albuquerque Metropolitan Arroyo Flood Control Authority engineer John Kelly to trace the history of the snowman, which by tradition is emplaced along Interstate 40 just east of the I25 interchange on the Monday after Thanksgiving:
Kelly was there at the start back in 1995 when a group of the agency’s executives cooked up the idea of a tumbleweed snowman out behind their main office between Menaul and the interstate.
“Some things are worth doing for fun,” Kelly explained.
Tuesday, Kelly pulled up in a pickup truck on his last day on the job, bearing a sack of burritos for the crew’s mid-morning break and eyeing the snowman’s rising three-lobed physique.
Spray-painted white, three tumbleweeds are assembled atop a steel frame that Moya and his colleagues have refined over the years. A sturdy steel hat with “AMAFCA” on the front sits atop his head as he greets drivers speeding past on the interstate.
Legend has it that Larry Trujillo, the flood control authority’s maintenance supervisor, looked at Kelly like he was crazy when the idea first surfaced 15 years ago.
Trujillo, sitting in an office Tuesday morning overlooking the yard where the snowman assembly was under way, did not dispute the legend. But he seems to have softened over the years, now that he has grandchildren: “They say, ‘Grandpa, grandpa, we see your snowman!'”