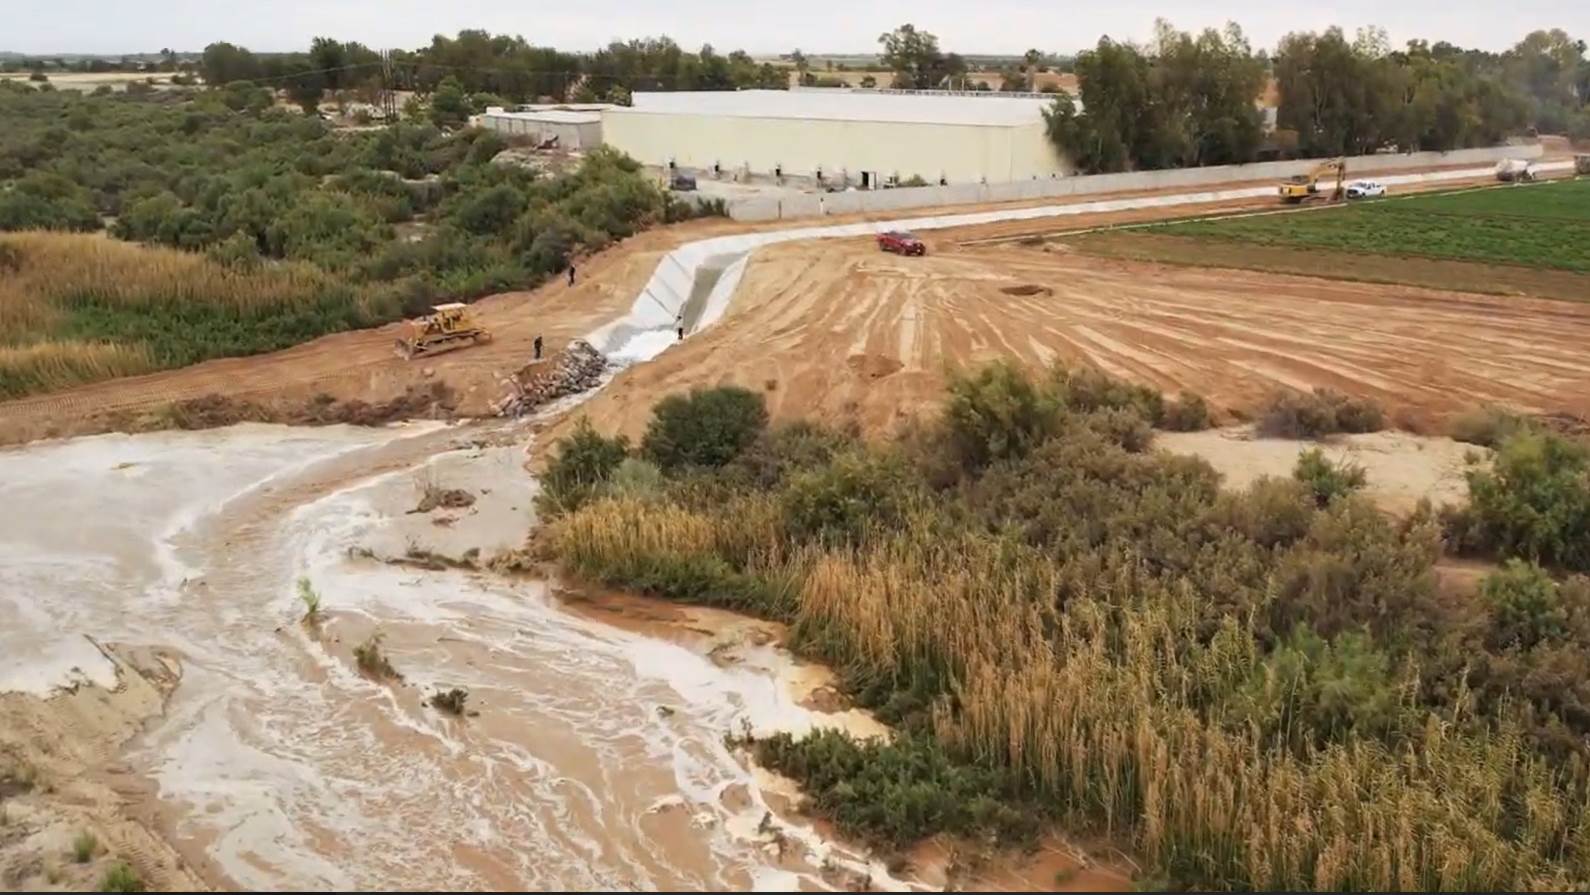
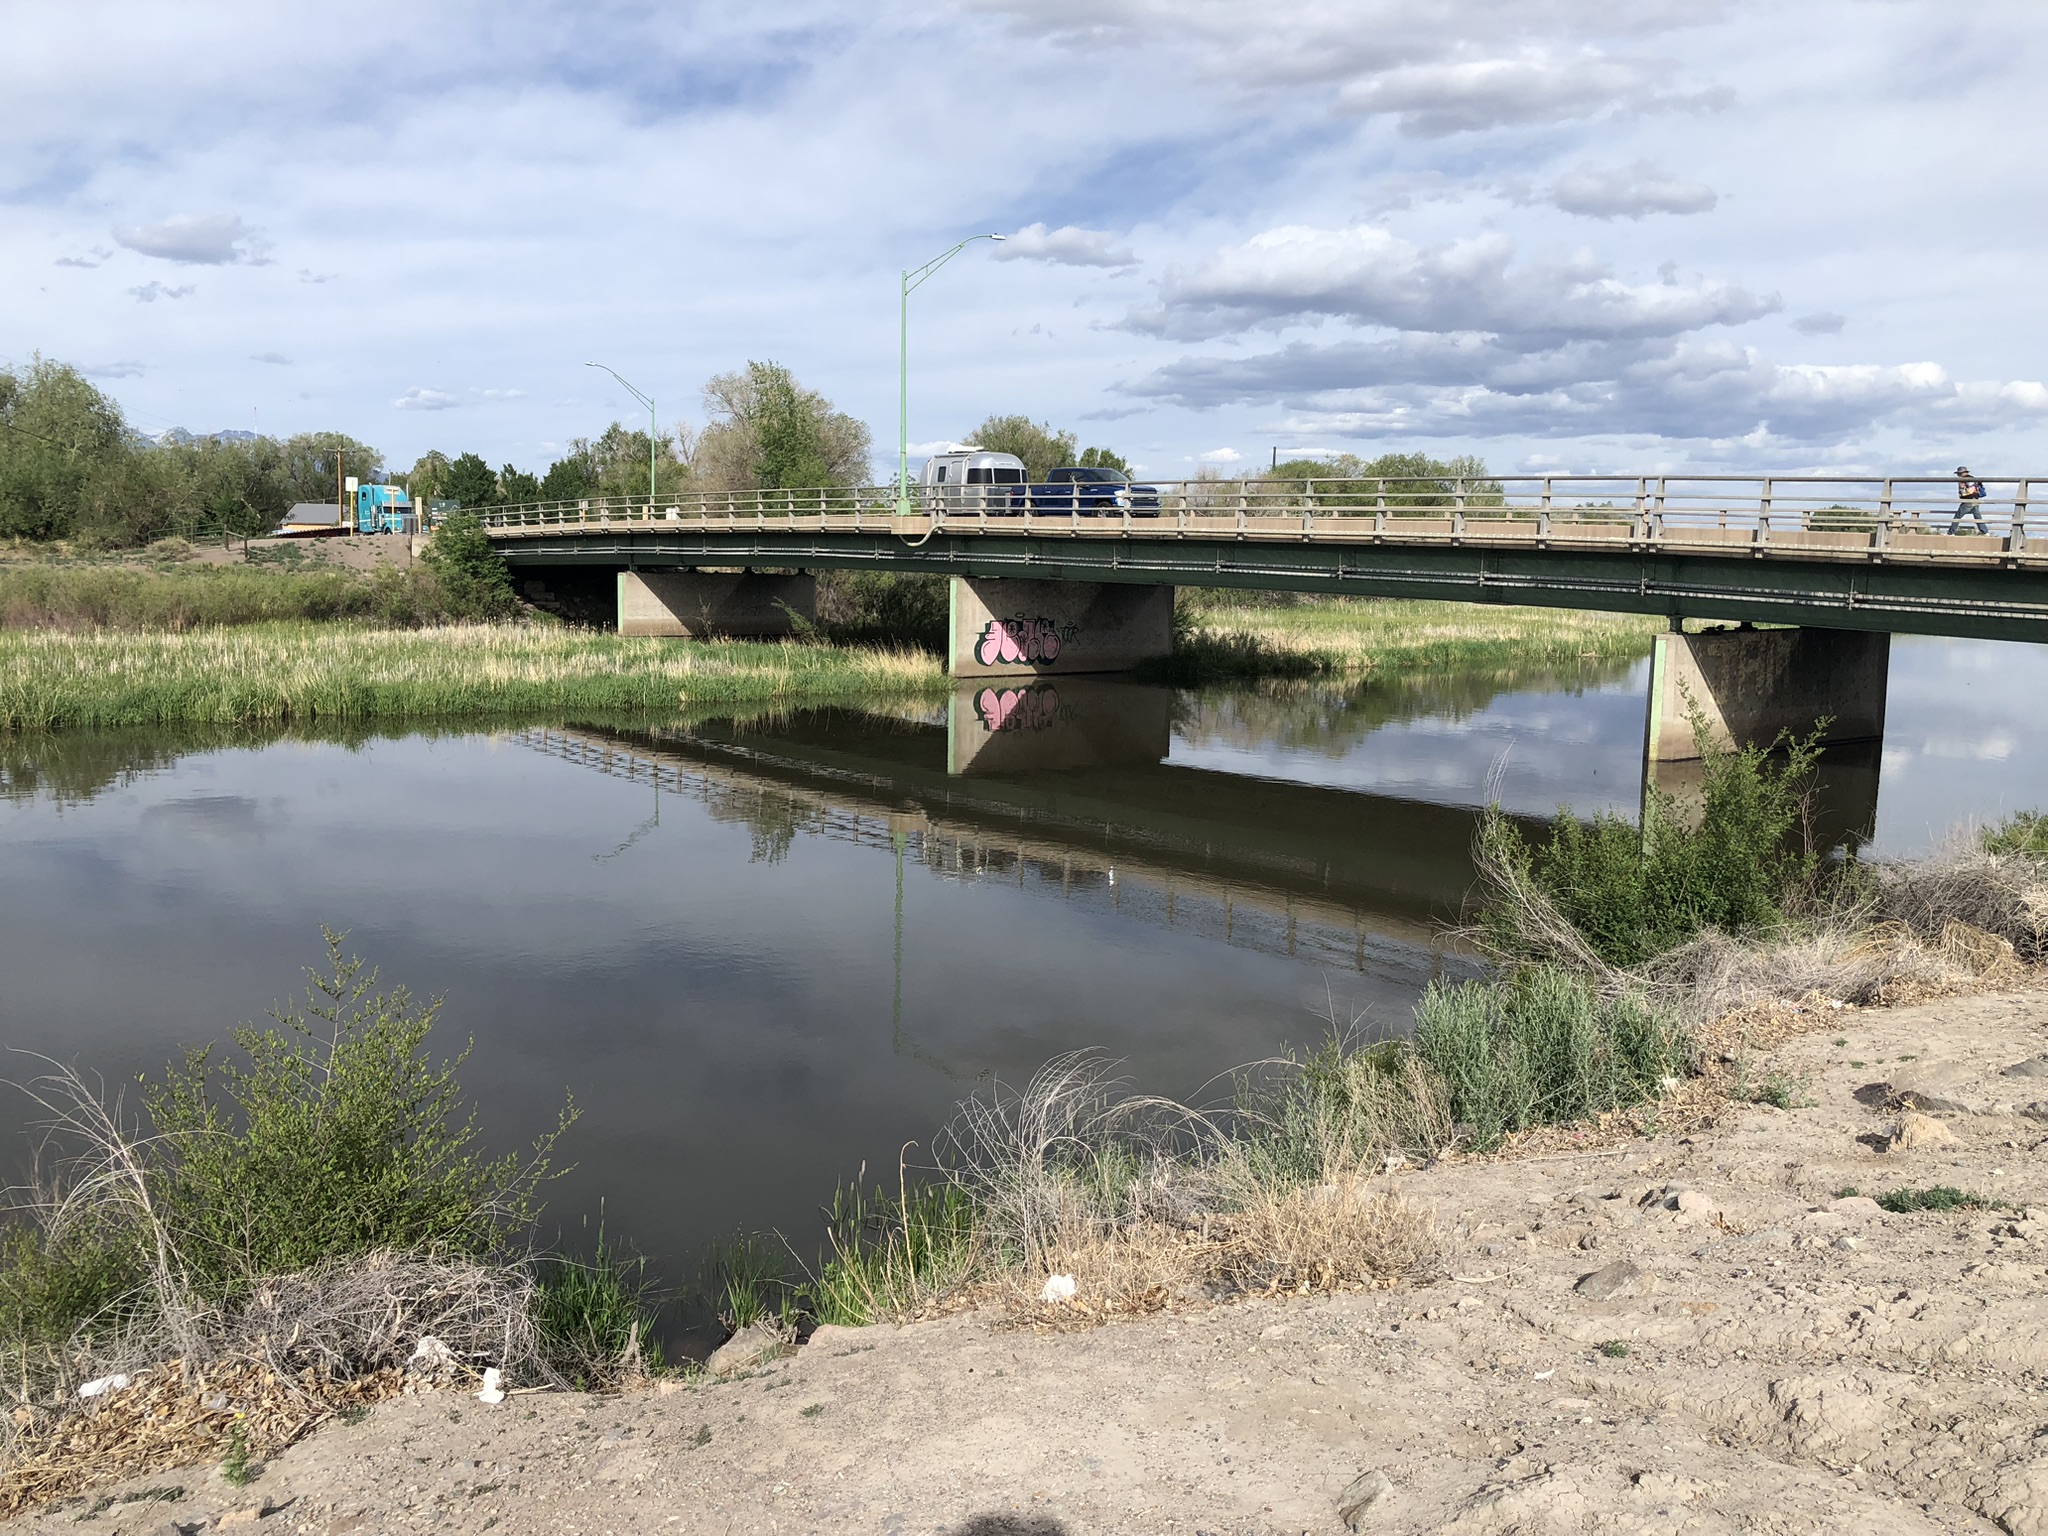
Albuquerque shutting down its river diversions because of low Rio Grande flows, going to groundwater

Stream entering a muddy river channel.

July 22, 2022, when wastewater from Albuquerque’s sewage treatment plant was the only thing keeping the Rio Grande here wet

Area water managers were informed this morning that the Albuquerque Bernalillo County Water Utility Authority will shut down its diversion of water from the Rio Grande for use in the municipal drinking water system, switching over to groundwater pumping to meet municipal needs.

The reason is low flows in the river. Albuquerque is constrained by a 2004 “biological opinion” from the U.S. Fish and Wildlife Service, which requires the municipal utility to shut down to minimize impact on the endangered Rio Grande Silvery Minnow.

The water Albuquerque diverts – when we’re diverting – is half water from our San Juan-Chama Project transbasin diversion (Colorado River water!) and half native water. We then kinda sorta return the native water to the river via the wastewater treatment plant. The idea is that half of it we consumptively use by dumping the Colorado River water on our lawns and trees, while the native water we run down the sink, clean up, and return to the river – an accounting exercise intended to leave the river whole.

The creates a weird bonus in the short run for the river when this happens, because now we pump groundwater to meet all those needs, and then dump some of that into the Rio Grande, thereby increasing the river’s flows in the short run.

Last summer, for a brief period of time, that pumped groundwater/wastewater was the only thing keeping the Rio Grand wet through the southern end of the Albuquerque reach,.

Rio Grande through Albuquerque could dry again this year

River flanked by woods with desert bluff to the left and tiny hot air balloons dotting the sky

Rio Grande in Albuquerque, Aug. 4, 2023. Photo by John Fleck

The Rio Grande, already dry in the San Acacia reach south of Socorro, has begun drying in the Isleta reach south of Albuquerque. And with a record hot dry summer, we could see it dry in Albuquerque again this year, as it did last year for the first time in 40 years.

Via Dani Prokop:

New Mexico’s largest river could dry again through the state’s largest city, for the second time in about forty years, if the monsoons continue to be weak.

“We could see drying in Albuquerque as early as mid-August,” (the USBR’s Carolyn Donnelly) said.

Problem 1 this year is that it’s hot and dry. Problem 2 is that El Vado Reservoir, built in the 1930s to store spring runoff for use at times like this, is under repair. So the stored water that would provide both irrigation and environmental benefits is unavailable.

This morning’s water management notes from the USBR noted 30 miles dry in the San Acacia Reach and a mile of dry riverbed in the Isleta reach.

Flow this morning through Albuquerque was a bit above 300 cubic feet per second. The median for this point in August is ~600 cfs.


Ribbons of Green: what we mean by “water policy”

aerial view of a bridge across a river

The interstate bridge being built across the Rio Grande, Albuquerque New Mexico, 1969, photo by Walter McDonald, courtesy Albuquerque Museum

Breaking out of my old “water policy writer” habits is hard.

The bridges of Albuquerque are helping.

Counting and Measuring

Prepping for an appearance on this Friday’s New Mexico In Focus on NMPBS, I’ve spent a bunch of time the last few days digging through agricultural water use data. (Spoiler alert: Ag water use has been declining in New Mexico for decades. Climate change adaptation is happening. When people have less water, they use less water.)

That’s long been a staple of my water policy writing – USDA NASS, and Cropscape, my beloved USGS Water Use in the United States data series, and on and on and on. You can’t manage what you don’t measure, amiright?

But our new book Ribbons of Green: The Rio Grande and the Making of a Modern American City, has me staring down the limitations of approaches I’ve used for so long.

Bridges

My coauthor Bob Berrens and I are deep into bridges right now. The literal physical objects that get you from one side of a river to the other. You can’t build a city on a river valley floor without confronting the collective action challenge of bridges.

Who builds (read “pays for”) them? Where do you put them?

In the 1920s, people in Albuquerque engaged in political struggles between neighborhoods that wanted bridges. Sixty-seventy years later, there were political struggles based on communities that didn’t want them.

Defining “water policy”

Bridges are not the only example of our attempt in Ribbons of Green to embrace an expansive definition. We’re writing about parks and recreation. We’re writing about evolving cultural relationships with the Rio Grande, including deep and diverse relationships with the act of irrigating and growing food. We’re writing about trees, and fish.

I’m reading Rudolfo Anaya right now. His characters go down to the river. That’s admissible evidence.

Establishing parks, and building bike trails, helps shape a community’s relationship with the river. That’s water policy.

Building fences to keep kids from drowning in irrigation canals helps shape a community’s relationship with the river. That’s water policy too.

Protecting wetlands? Water policy.

Regulating waterfront development (either encouraging it or prohibiting it)? Water policy.

Cutting down trees along an irrigation ditch to conserve water (or leaving them there as shade for the ditch walkers)? Water policy.

Fishing rules, canal trails, historic preservation and commemoration of the old canal headings at Atrisco? Water policy.

All of these things have a common characteristic: they reflect the tradeoffs we must make, the often competing and conflicting values we must articulate, things lying at the intersection of economic resources, ecological resources, and public infrastructure that define what Albuquerque has become as a modern city.


In Albuquerque, a record for July unpleasantness

Graph with white background, green line showing rising average Albuquerque temperature for July since 1891

Courtesy xmACIS

July is, in general, Albuquerque’s hottest month. This year’s was the hottest July we ever had.

All kind of weather records….

  • Average overnight low of 72.3F was the warmest for that measure in a dataset going back to 1892.
  • Total measured precipitation at the airport, our official measurement station, was just a trace – tied for driest since 1892.
    • With a similar record for June (tied with a bunch of “T’s” in the record) this is driest summer “rainy season” we’ve had since record-keeping began
  • Average high of 99F was a smidge below 1980’s record 99.1

It’s worth noting what my econometric colleagues would quickly point out here as “colinearity” – these aren’t fully independent variables. This is the point where I smile, nod knowingly, and leave the details to smart graduate students.

Yesterday (July 25, 2023) was the hottest day in Albuquerque history

By one measure of overall heat, yesterday (July 25, 2023) was the hottest day ever recorded in Albuquerque.

This is a tricky one, the sort of extreme I used to love back in my newspaper days when I needed a hook to slip stories like this past the filter of my editors. The daytime high of 103 was a daily record – the hottest July 25 in records going back to 1891.  (Can confirm that my bike commute home at 5 p.m. was unpleasant.) But it fell well short of the all time high, 107, on June 26, 1994.

But in a note sent around to CoCoRaHS observers, Michael Anand of the National Weather Service’s Albuquerque office did the full weather nerd thing for us, noting that the daily average temperature of 90 – the mid-point between overnight low and daily high – was the hottest by that measure in that aforementioned history of more than a century of record keeping.

Other records of note:

  • driest start to a summer monsoon, as measured by total measured rainfall at the official airport station since June 15 – just a trace
  • on track for hottest July ever, based again on that overall daily average temperature
  • longest streak of temperatures never dropping below 70 – 12 days, ending July 21
  • longest streak of daytime highs over 95 at 24 and counting (based on the current forecast, we’re gonna add at least 7 more days to that record)

But Michael’s news is not all bad!

Good news is that we are looking at indications of the high pressure responsible for the extreme heat to gradually weaken and shift east over the Great Plains early to mid next week allowing for temperatures to cool closer to normal for this time of the year as well as allow some monsoon moisture to enter western and eventually central NM! Let’s hope this signal pans out!

On Bridges

Members of Albuquerque’s Brownie camera club at the Barelas Bridge, circa 1916, courtesy Albuquerque Museum photo archive

The fancy new Barelas Bridge, built in 1910 across the Rio Grande on what was then the southern edge of Albuquerque, was a big deal. The Albuquerque Museum photo archive (some on line here, more that I’ve begun studying at the museum for possible use in the new book) has a bunch of pictures of the old Rio Grande bridges – people documented them, again and again.

Alameda Bridge, circa 1935.

The old Barelas Bridge was a wooden relic, rickety and unreliable. The new 1910 bridge was all steel and modernity. It allowed workers in Atrisco, across the river from Albuquerque, to reliably get to their jobs in the rail yard. It allowed farmers to get their crops to market. It, and a second bridge like it built around the same time at Alameda at the north end of town, made possible a community that spans a river.

When we think of the collective action problems around the Rio Grande that Albuquerque needed to solve to become a modern city, we mostly think about flood control, drainage, and irrigation. To understand a city, as I have written and said many times, you can always start with the water – the choices a community makes to solve water’s collective action challenges. Bridges belong on the list.

#GeographyByBike – Riding the Ribbons

Graffiti bird on freeway bridge piling looking out across dwindling Rio Grande with muddy sand in foreground and a blue with homes atop it in the background. Early morning golden light.

The Bird watching over a dwindling Rio Grande. To the right is the pedestrian-bicycle bridge, to the left is Interstate 40.

My mental map as I ride my bike across Albuquerque’s Rio Grande Valley floor has grown increasingly complex in the last six months as we’ve added layer upon layer of historic maps to the research for our forthcoming book Ribbons of Green: The Rio Grande and the Making of a Modern American City.

Yesterday morning, I rode at sunup, picking a path on sidestreets and the bike trail paralleling the freeway – a modern geographic feature that constrains Albuquerque’s urban form in a way similar to the way the Rio Grande served as an organizing principal for the human geography a century before. If you’re patient and have air conditioning in your car, it’ll get you all the way to Daggett in California’s Mojave Desert (I-40 actually ends in Barstow, just down the road, but Daggett has cooler stories).

The freeway bridge across the river is one of my favorite urban river spots, especially because of the graffiti. Regular readers should recognize one of Irot’s birds monitoring the Rio Grande on our behalf. The east side is just off the levee and easy to get to. The art is better on the west side, but getting there involves a gate, a very steep hill, and questionable legal behavior. I’ve only been once.

I rode early enough, to beat the heat, that the only business open was the methadone clinic, which was hopping. It’s in an underused industrial area, between the railroad tracks and what was once the American Lumber Company’s sawmill. The bike trail passes north of what’s now called the Sawmill District, which has some nice dense modern housing and a big food court open market thingie of the sort that’s all the rage right now. (Nobody goes there, it’s too crowded.)

Canal with water passing beneath a freeway with motel to the right and "Middle Rio Grande Conservancy District" sign in the foreground.

The Alameda Drain, passing beneath Interstate 40

A zig (zag?) through the neighborhood takes you past where the Alameda Drain passes under the freeway, another classic urban water feature. I need to go back to get a better picture, it’s a bit of a spectacle – lovely mini-ribbon of green with freeway off ramp and a motel.

The drains are so important to our book’s story, and so hard to get my head around. One of the central themes of the book is the way in which human communities completely rejiggered the valley’s hydrology, and the drains played an incredibly important role. Before they were dug in the 1930s, this area was swampy. My best guess based on nearby USGS groundwater monitoring data is that the depth to groundwater here today is 10-11 feet below the ground surface. The drains, dug in the 1930s, were designed to lower it to that level and drain the water off to the river for use downstream. In the process, the drains (along with levees to confine the Rio Grande to a narrow channel rather than spreading out in spring runoff), radically altered the valley floor.

That was the intent. As Steve Reynolds, the venerable New Mexico state engineer, once said, it’s hard to build a city in a swamp.

Just up the trail, I rode across what was once “Palmer Slough”, a favorite swimming hole for the locals, known for Boy Scout outings and the occasional drowning. The drains and levees acted like a moat between city and river, and I’m still trying to wrap my head around how the community’s relationship with the river changed, basically in a single year, as the draglines scraped their way down the valley floor.

Small irrigation ditch flowing through suburban gardens.

Water in the desert

Today it’s easy to get to the Rio Grande along this stretch because of walking trails and bridges across the drains. Yesterday’s bike ride used a big beefy metal bridge (slippery when wet!), strong enough for fire trucks to get in, a response to our big bosque fires of 2003.

On the way home, I rode up the valley to another bike trail that parallels the Alameda Drain. We’re slowly but surely repurposing them for recreation. I saw folks watering their lawn off of one of the irrigation ditches (in what I think is the old main house of Matthews Dairy, the dairy’s land long ago repurposed as subdivisions). And this, a little irrigation ditch through neighborhood gardens. It’s been screamin’ hot here the last couple of weeks, and I can really see the attraction. The repurposing of old irrigation ditches for gardens and bike trails is at the heart of our story about how the “ribbons of green” have made modern Albuquerque, but in a way very different from that which was intended when they were built.

We’ve repurposed the Rio Grande in the making of our modern American city.


Downtown Albuquerque News: My Favorite Albuquerque News Source

I was delighted when veteran journalist Peter Rice started publishing the Downtown Albuquerque News, an emailed daily M-F news source for downtown Albuquerque. I also figured it was nothing more than a happy experiment, and probably wouldn’t make it.

I am remain delighted with DAN as a reader, and am also delighted to have been wrong about the economics of the project. And I don’t even live downtown!

Today’s edition included the best writeup I could have hoped for about the challenge of redesigning Albuquerque’s bus network in the face of competing objectives – frequency of service versus spatial distribution. I use a car as little as possible, I mostly use a bike (regular or E, I have a lot of bikes), but the buses are a fallback that I frequently use. Peter’s deep, explanatory dive into the issue is a marvelous look at the tradeoffs involved, backed up by a thoughtful explanation of the survey data.

The biggest predictor of how people feel about the coverage/frequency question in practice turns out to be how much money they make and how often they actually ride buses. Riders who make less than $25,000 per year prefer spread-out-and-infrequent service by nine points. For the most frequent riders, it’s a tie. For higher-income (though often by no means rich) and less-frequent riders, however, the preference swings back to frequency.

I’m in that last camp (higher income and less frequent), but every time I ride the bus I am reminded that my privilege and desires are less important that “riders who make less than $25,000”. They need this more than I do.

So yes, Peter’s dishing out some of the best policy writing about stuff I care about, even if I live one neighborhood away.

But it’s also full of delightful whimsy about art and community.

Best $10 a month news buy I make (and I make quite a few).

Deadpool Diaries: mid-July Colorado River status report

Ringside seats to the decline of Lake Mead

Sometimes all we can do is sit and watch and wonder

When last we visited, Lake Mead sat at elevation 1,054.28 feet above sea level. It’s now at 1,058.34, which is up ~13 feet from when I took the above photo last December.

I hope they moved those chairs.

The good news is the current forecast calling for the combined storage of Lake Mead and Lake Powell to end the water year up nearly 5 million acre feet from a year ago.

The bad news is that total identifiable water use reductions in this year of chaotic crisis fire drill total just 1.2 million acre feet, according to the Bureau of Reclamation’s July 14, 2023 forecast.

State Base allocation 2023 2023 reduction percent cut from base 07/DCP Cut beyond 07/DCP
California 4,400,000 4,068,756 331,244 7.5% 0 7.5%
Arizona 2,800,000 2,008,505 791,495 28.3% 592,000 7.1%
Nevada 300,000 201,923 98,077 32.7% 17,000 27.0%
Total 7,500,000 6,279,184 1,220,816 16.3% 609,000 8.2%


This is not enough.

Who’s Using What?

Kudos to Southern Nevada, which at ~202kaf is on track for its lowest take on the Colorado River since 1992. Clark County’s population has nearly tripled in that time.

At ~860kaf, the Central Arizona Project is on track to make its lowest draw on the Colorado River since 1995.

At ~803kaf, the Metropolitan Water District of Southern California’s forecast draw on the river is taking 12.5 percent less than its average over the last decade, but Met is weird because of California State Water Project wet year chaos, so I’m not sure I fully understand what they’re up to. (Jump in the comments and explain, Met friends!)

The Imperial Irrigation District is forecast to take ~2.5maf from the river this year, which is basically unchanged from its use over the previous decade.

What is Needed

The analysis by Jack Schmidt et al suggests that, based on 21st century hydrology, we need to cut 1.5 million acre feet per year just to stabilize the system. If we want to actually refill a bit, to provide cushion against the sort of catastrophe that was narrowly averted this year by a big snowpack, the cuts need to be even deeper.

Four decades of dithering, with the last big snowpack circled in red.

The above graph from their paper shows the problem. I’ve circled the last big snowpack year in red, and you can see the others as well. Every time we got bonus water, we just used it.

We need to avoid making that mistake again.

Thanks

A big thanks to friends of Inkstain for helping support this work.