Chicago Tribune, June 3, 1934:
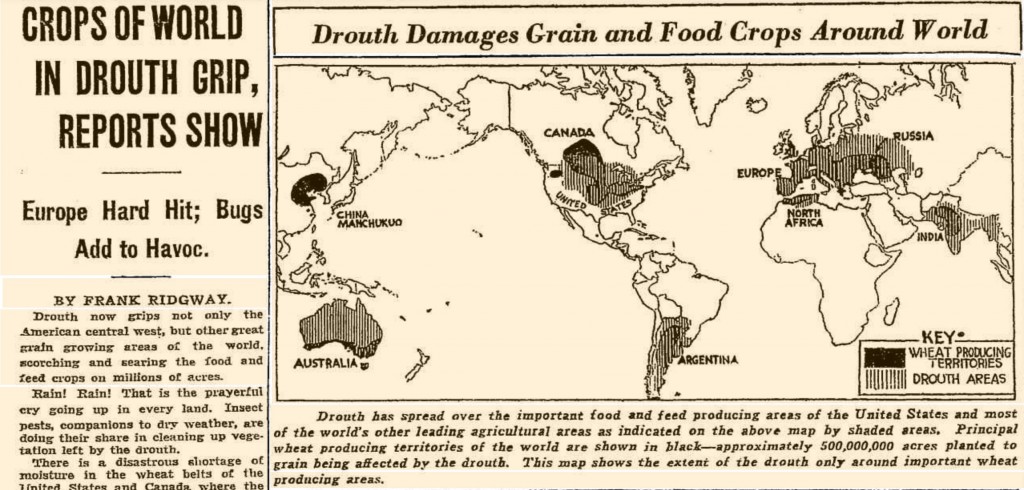
Also, insect pests

Chicago Tribune, June 3, 1934:
Also, insect pests
I joke that I kept trying to leave the Salton Sea out of my book, because it’s such a hairy problem that in threatened to derail me in so many ways. Of course I failed, because the Sea is a critical piece of solving the distributional problems of scarce Colorado River water. Agricultural reductions in the Imperial Valley reduce tailwater flows to the Sea, shrinking critical habitat and creating health risks for the communities that surround it. (Mike Cohen offers a good rundown of the issues here.)
Via Ian James, some modest but encouraging news this week on that front:
The federal government plans to spend $3 million this year constructing a new wetland along the Alamo River in order to rehabilitate habitats and help clean up some of the polluted water flowing into the Salton Sea.
$3m is just a fraction of what is needed, but it’s bigger than zero.
I don’t want to get out ahead of things, because we’re still trying to understand what the current gonzo El Niño means for global weather, but the monthly outlook from the U.S. Climate Prediction Center now has the odds at 50-50 that we’ll be in La Niña by fall:
Most models indicate that El Niño will weaken, with a transition to ENSO-neutral during the late spring or early summer 2016 (Fig. 6). Thereafter, the chance of La Niña conditions increases into the fall. While there is both model and physical support for La Niña following strong El Niño, considerable uncertainty remains.
La Niña by fall
A reminder that El Niño tilts the odds toward wetter weather across the southern tier of U.S. states, La Niña does the opposite, and the Colorado River Basin as a whole is a coin toss.
The Pacific Institute and others have published a useful new study on “Incentive-based Instruments for Freshwater Management” which raises some interesting issues about the language we use to describe water policy instruments.
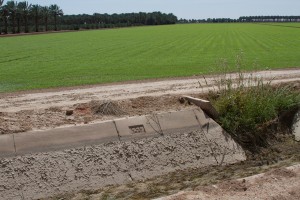
The farm district in Bard, California, is negotiating with urban water users to fallow cover crops like this and send conserved water to the city
Deep in Abrahm Lustgarten’s excellent new piece about water markets in the West is this description of the arrangement by which the Metropolitan Water District of Southern California pays farmers in Palo Verde (the deserts east of Los Angeles) to fallow fields so that water can be transferred for municipal use in coastal Southern California:
The arrangement is anything but a free market: To ensure that most of the water stays in the valley, the agreement limits the amount of land any one farmer can fallow in a year to 35 percent of his or her holdings. Still, farmers get added income without losing their rights to the water, and the Metropolitan Water District says Los Angeles and its other cities get reliable access to water, which helps them make it through drought years.
The distinction here is between “free market” and more regulatory approaches that specify in law who gets how much and for what, but I think what’s happening in Palo Verde has important market characteristics that matter. I think we’ve been getting wrapped around our axle in trying to fit this square peg into the round “water markets” hole. These things will never be like buying and selling oil. Water, as the Pacific Institute study notes, has a lot of characteristics that make normal markety stuff impossible:
It is heavy, unwieldy, and easily contaminated; it sometimes has dramatic seasonal and year-to-year variability; and it can be easily lost through evaporation, seepage, or runoff…. Further, these externalities may be borne by disparate parties, such as the environment or future generations, challenging efforts to compensate those injured by trading.
One of the points Robert Reich makes in his new book is that markets are at root institutions created by political systems, so by design if you do build a “water market” you end up with institutional arrangements that either do or don’t take the problem stuff into account.
Institutional arrangements are among the most important factors that determine the ultimate success or failure of water trading. Successful water trading requires secure and flexible water rights that recognize and protect users and others from externalities.
When we talk about “markets” in all this, the generic language prejudices us toward a specific notion of freeness of buying and selling, but really these things are always bound up with incredible institutional constraints that make very few of them look like buying and selling hog bellies*. That’s why I really like Cohen et al.’s language of “incentives” instead. It allows for a lot of the characteristics many people like about markety stuff, but allows for a lot of the kind of boundaries and constraints that Lustgarten argues make it “anything but a free market”.
Yes. Exactly.
Which brings us to Bard, the little irrigation district across the Colorado River from Yuma, in the far southeastern corner of California.
The Metropolitan Water District of Southern California and the Bard Water District last month launched into a new arrangement in which Bard farmers can be compensated for fallowing fields during the hot late spring and summer months. Bard farmers do a lot of winter lettuce, for which they make a lot of money. Then, as is common for the winter lettuce trade, they plant the land in a cover crop – maybe cotton or sudan grass or something – that makes a lot less money. Negotiations are now underway on deals in which Met would compensate farmers $400 an acre to fallow instead during those months.
This has a lot of the characteristics of a market – willing buyers and sellers who have negotiated a price. But it is anything but a free market. There are a lot of constraints – limits on total acres involved, and it only applies to fallowing and water transfer during a few months of the year. Those are constraints intended to manage the externalities – keep agricultural land in production, protecting community of origin values.
I really like the language of “incentives” rather than “markets” here. It gets us past a hurdle that has hampered the conversation.
* I got “hog bellies” into a blog post. Achievement unlocked.
Via Brett Walton at Circle of Blue:
Per capita water use declined 30 percent from 2000 to 2015, and total water consumption within the metro Atlanta area declined over 10 percent despite a 20 percent increase in population.
That’s from the Georgia Department of Natural Resources (pdf). As Brett notes, “Georgia now says it does not need a new reservoir that is going through federal permitting.”
In the gift shop at Hoover Dam, I found this:
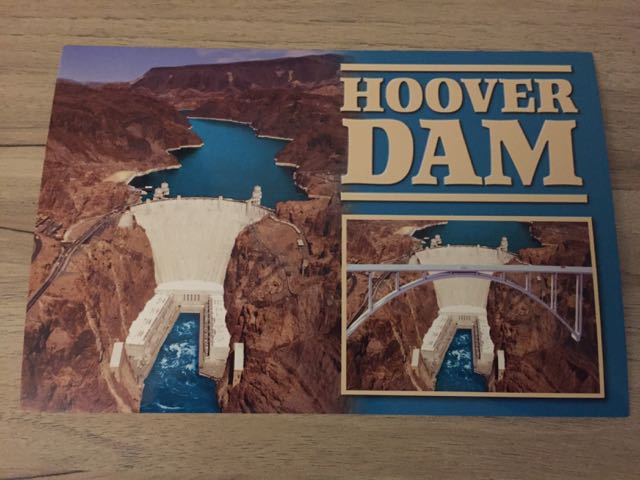
Lake Mead, full
It’s actually an artist’s rendering of the new bridge, done sometime before 2007. By the time the bridge was actually finished in 2010, Lake Mead was kinda empty and the white bathtub ring was kinda big. Mead hasn’t been this full since the late 1990s.
In his keynote at last week’s Law of the Colorado River conference in Las Vegas, Metropolitan Water District General Manager Jeff Kightlinger pointed out something that’s not gotten a lot of attention in discussions of California’s drought – the extraordinary decline in that state’s acreage of cotton. Cotton’s gotten a bad rap in irrigation circles, because it’s subsidized and thirsty. Despite those subsidies, as I’ve written, cotton acreage in Arizona has plummeted, which is why I don’t see the cotton subsidy as a big piece of the western water problem. But I didn’t realize the size the decline of California’s cotton industry.
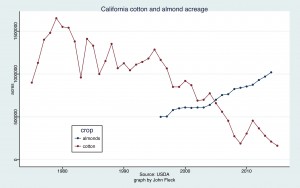
Source: USDA
Last year there were 164,000 acres of cotton grown in California, just a tenth of the 1979 peak of 1.65 million acres. Given cotton’s thirstiness, that drop would seem like a good thing in water management terms. But Kightlinger pointed out that a big part of what we’ve seen is a shift away from a temporary field crop like cotton, which can be fallowed in a dry year, to permanent almonds. In the old days, when Met wanted to go out on the market and buy ag water during a dry year, farmers could fallow a field crop like cotton and take the money. But last year, Kightlinger explained, Met ended up having to bid against almond farmers with a lot of investment riding on keeping their orchards alive. As a result, there wasn’t a lot of ag water to be had in Met’s price range, and the agency ended up shifting the money to a turf grass buy-back program in Southern California – fallowing lawns, if you will.
It’s not been a one-for-one acreage switch. Since 1996 (that’s as far back as I could find the almond acreage to do the comparison), cotton acreage has dropped by nearly 900,000 acres, almost all of that in the San Joaquin Valley. (California alfalfa, the other high water, low value irrigated crop is down ~150,000 acres statewide during that period.) Almond acreage during that time is up about 500,000 acres. So the net in acreage of those big three irrigated crops is down a lot, with the almond increase more than offset by the cotton and alfalfa decrease. But while that means less total water use, Kightlinger’s argument points out the loss of flexibility in the shift to crops that you can’t fallow when the water runs short.
Ry Rivard in Voice of San Diego:
As San Diego benefits from its new supplies of water, its customers are cutting their water use.
That means San Diego now has more water than it needs.
This is what I’m talking about Friday at the Law of the Colorado River conference. It’s the core of the solution space.
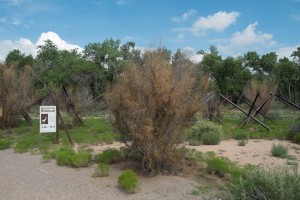
A tree hit by tamarisk beetles, Albuquerque’s Rio Grande bosque, July 2015, by John Fleck
The tamarisk beetle, introduced in 2001 as a strategy to control “invasive” tamarisk trees in the United States, is “expected to
spread throughout the entire (Colorado River Basin), and tamarisk presence, distribution and abundance will likely decline as a result,” according to a new report (pdf). “Tamarisk beetle in the Colorado River basin”, written by Ben Bloodworth of the Tamarisk Coalition, Pat Shafroth of the USGS, and colleagues, documents the findings of a major workshop last year.
The scare quotes around “invasive” are a reference to the issues raised by biologist Ken Thompson’s book Where are Camels From. Our ideas about “native” and “invasive” are in part social constructions, Thompson argues. How long has the newcomer been here? Do we “like” it or not? How do they fit into the changed environment we’ve created?
With the changed hydrology of dams and diversions on our western rivers, we’ve got a sufficiently altered system that the “native” biota we’re trying to protect are often ill suited to the new environment we’ve created. With tamarisk, that means that we now have “native” critters that do well in tamarisk because the old flood plain habitat in which they lived is gone, on account of no floods. Two key points from the report:
- Tamarisk beetles are expected to spread throughout the entire CRB, and tamarisk presence, distribution and abundance will likely decline as a result.
- The expected effects of this tamarisk decline on native plant species are dependent upon a number of environmental factors that may be useful in predicting outcomes. Most important is the degree to which the system has changed from historical conditions, including dynamism of the river, soil conditions, and the state of the remnant native plant community.
So for example the endangered willow flycatcher may suffer as a result. With its native habitat gone, it’s made a new life in the tamarisk, which will be harder now.
The report suggests that a more natural, spread out hydrologic system may be possible as tamarisk declines, but only in river systems that have something approximating their natural flow regime.
I’ve begun putting scare quotes around “done”, but we just passed a major milestone deserving of the word – done – with my upcoming book on the problems facing the Colorado River Basin and what I think solutions might look like. The book is now fully edited and entering the production process at Island Press. And when I say “fully edited” I have to add the scare quotes too, there are a couple of more rounds of copy editing and proofreading as part of said production process. But It’s now largely off my desk and into the hands of the professionals.
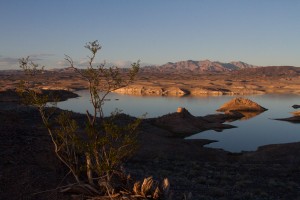
Lake Mead at sunset, by John Fleck
If I was a better writer I’d have a good metaphor here for the strange time-shifting experience of writing a book. Maybe a life that spans global time zones – I’m over here on one side of the International Date Line done with it, and y’all are off there on the other side waiting until next fall to read it? (You are anxiously awaiting the chance to read it and buy copies for all your family and friends, right? Put it on the holiday shopping list now.) Maybe the metaphor is the old days when news had to travel by boat around the Horn?
It’s a weird limbo, starting to work on other projects (I’ve already written some other stuff, teaching is the most fun right now), starting to think about what a next book might look like, while the thing that sorta feels behind me (The Book) is still very much ahead of me.
The last task was the acknowledgments, and it was the hardest, because so many people helped me. But I realized in sorting through the lists of the many people who gave their time and data and insights that they shared a common characteristic – a clear-eyed view of the difficulty of the Colorado River’s problems, combined with a persistent optimism that they can be solved.
I hope the book honors that zeitgeist, which I share – that the inexorable draining of Lake Mead demonstrates a clear problem in our relationship with water in the Colorado River Basin (we use too much of it!) but the litany of success stories I chronicle suggests significant progress, both in water conservation on the user end, and in institutional frameworks needed to manage the allocation of an increasingly scarce resource.
I’m off to Las Vegas this week for the annual CLE Law of the Colorado River conference. It’s a gathering of the community, and I’m looking forward to hearing the latest and sharing some of my ideas about where we go from here.
I’m driving over a day early, to spend time wandering around looking at water. It’s always been one of my great joys, getting down to the water, seeing how it moves through the system, and I’ve been in the writing tunnel and away from the water too much over the last six months. There’s a big reservoir out east of Vegas that I’ve grown fond of over the last few years, gonna pay a visit.