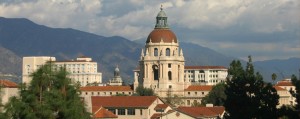
Courtesy City of Pasadena
Pasadena, a suburb of Los Angeles, is in the hunt for more water:
A recycled water project started in 1993 moved forward Monday night as the Pasadena City Council approved the environmental review of a plan to funnel water from Glendale.
The $50 million project could take 20 years to complete, with a pipeline running from a proposed reservoir in Scholl Canyon in Glendale to one at Sheldon Reservoir near the Brookside Golf Course. It would increase Pasadena’s local water supply by about 10 percent, officials said.
Pasadena, part of one of the earliest California efforts to regulate groundwater pumping, gets more than half its water from Metropolitan Water District imports, water from Northern California via the State Water Project and the Colorado River. The rest coming from the local groundwater basins. It’s always been of interest to me because it’s where I started writing about water in the late 1980s, as a newspaper reporter for the Pasadena Star-News.
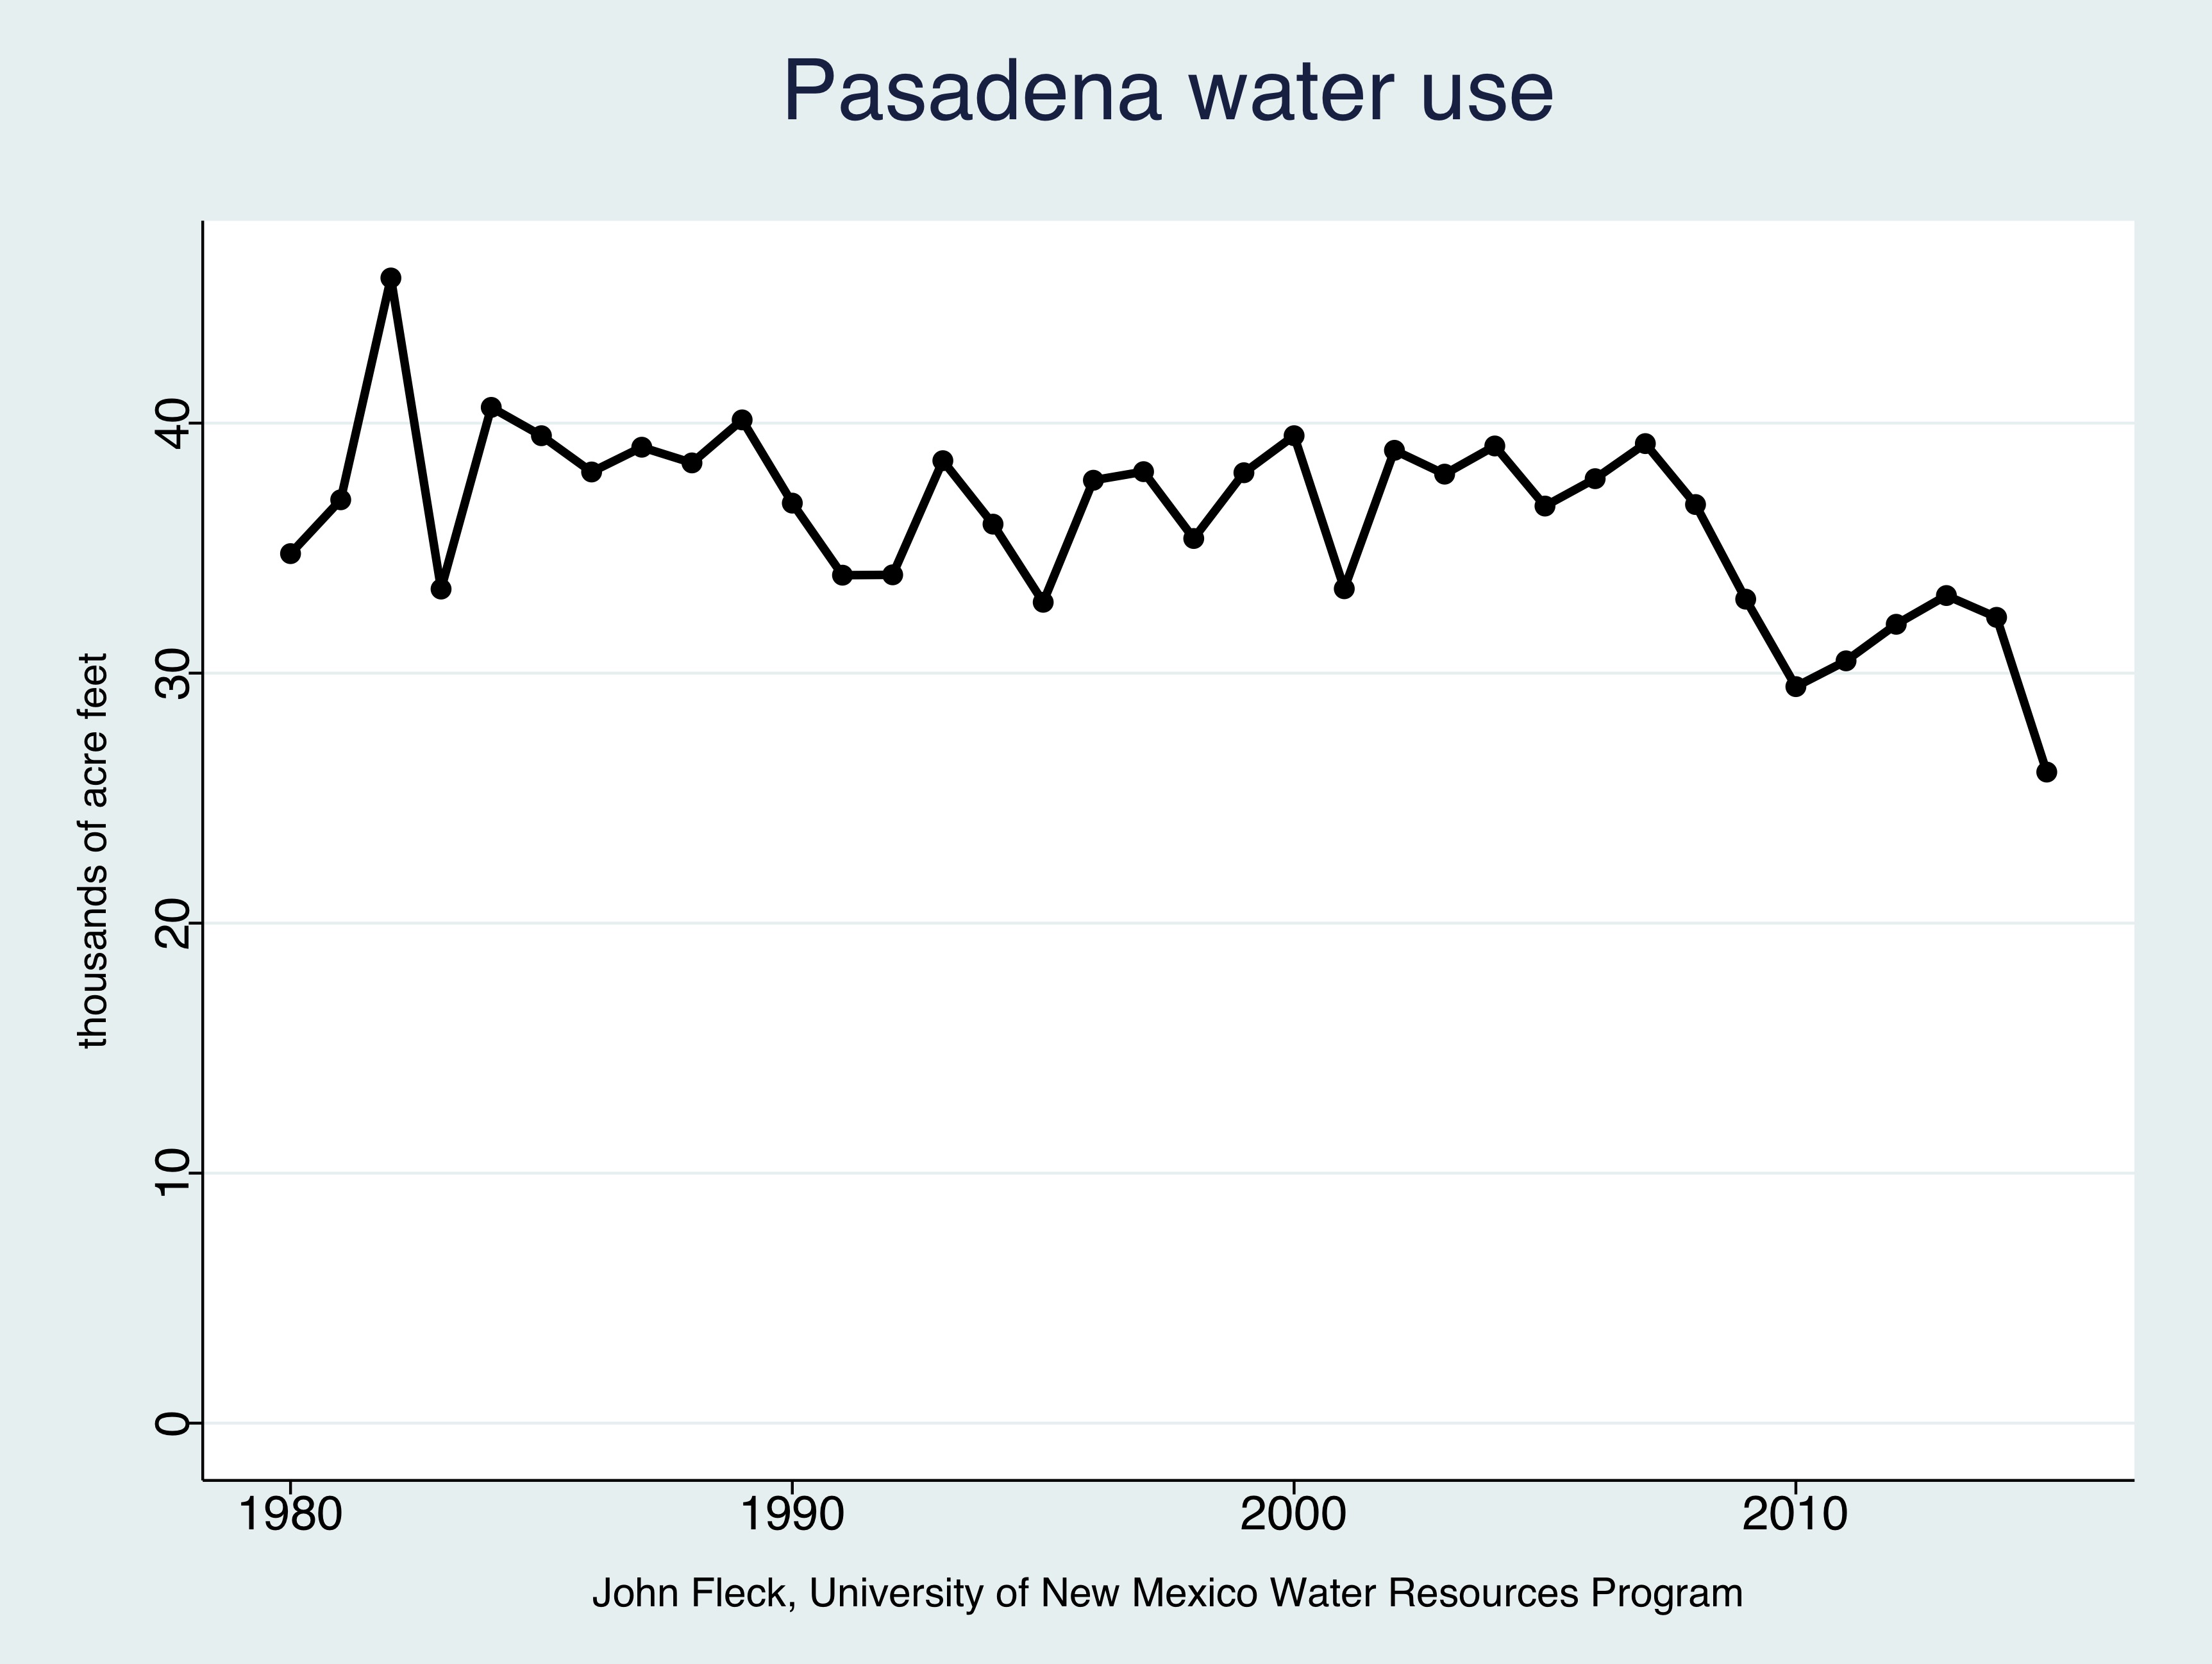
Pasadena, Calif., water use, 1980-2015
When Emily Green this morning linked to Jason Henry’s story on the new Pasadena water plan, it prompted me to pull the latest data on the community’s water use. The results are unsurprising. Like nearly every community I look at, water use is down.
Since we left 25 years ago, Pasadena’s population has risen 10 percent. Its total water use has declined 29 percent. Per capita use is down 35 percent. Water use in 2015 was by far the lowest in the 35 years for which I have data.
This graph represents total water use, the combination of local groundwater and imported supply from Met.
You can see the big drop in 2015, as Southern California water users respond to the drought-tinged regional conservation initiatives. But even before that, Pasadena was part of the overall trend toward reduced water use in the metropolitan western United States.
Everyone’s using less water.