One of the most important findings of environmental economics in recent decades is what is called the “environmental Kuznets curve”, a finding that as a community’s affluence rises, environmental “bads” – think air and water pollution, for example – decline. Could what has happened in Flint, Michigan, be evidence that this phenomenon is bi-directional – that as a community becomes impoverished, environmental conditions worsen?
In 1991 Princeton University economists Gene Grossman and Alan Krueger first documented this intriguing and potentially important relationship between wealth and pollution. At the time the United States, Mexico, and Canada were in the midst of negotiating what would become the North American Free Trade Agreement. NAFTA’s critics had objected that the deal would simply shift pollution from the more heavily regulated and affluent north to Mexico. Preparing for a conference on the deal, the pair looked at levels of sulfur dioxide and smoke pollution in 42 countries around the world. They found that as affluence grew in the 42 countries they studied, pollution grew along with it, but only to a point. Once per capita gross domestic product reached an inflection point ($4,000 to $5,000 in 1985 dollars), things turned around. It was as if, once people had their basic needs covered (food, housing, etc.) their desires turned toward a cleaner environment. The pollution curve, at least for sulfur dioxide and smoke, turned back down.
Could the expected income growth in Mexico, the pair wondered, push Mexico’s economy past the point at which the nation’s pollution curve bends back down? “A reduction in pollution may well be a side-benefit of increased Mexican specialization and trade,” they wrote.
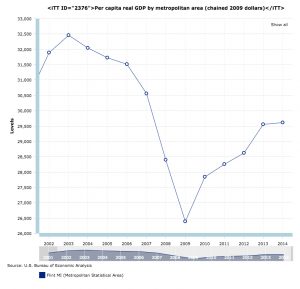
Per capita GDP, Flint, Michigan, adjusted for inflation, courtesy BEA
The inverted U-shaped effect of environmental damage rising and then falling came to be called the “environmental Kuznets curve” after the work of economist Simon Kuznets, who in the 1950s posited a similar relationship between rising income and inequality. The observation resonated in a world in which rich countries seemed to have turned a corner on their pollution problems with things like the U.S. Clean Air and Clean Water acts and the Endangered Species Act, laws that reflected a culturally noticeable pivot in the decades before Grossman and Krueger published their pioneering work. In the years following the paper, a flurry of studies put empirical flesh on the skeleton, measuring the relationship across a range of environmental “bads”, from urban air pollution and deforestation to climate-changing emissions of carbon dioxide. Researchers argued about the statistical measures and the underlying theory, about whether income and wealth were the right causal variables, but again and again, their curves showed the inverted U’s of an EKC.
The story of Flint is well known – a community gutted by economic change, and left in the process with lead-contaminated drinking water. In terms of both total and per capita GDP, Flint’s economy tanked from 2004-2009, then began to recover in the years since. So is this a thing? As communities get poorer, do things like clean water fall by the wayside? Is Flint an example worth looking at, or does the curve above suggest that the timing is all wrong? How might we look more generally for a reverse EKC?