Holding Course: February brings more of the same for basin storage

A guest post from Jack Schmidt, crossposted from Utah State University’s Center for Colorado River Studies

By Jack Schmidt | March 8, 2024

Reservoir storage didn’t change much in February 2024, demonstrating that the Basin’s water managers and users have succeeded in retaining the bounty of last year’s big runoff.

This month’s assessment of Colorado River reservoir storage will be short and to-the-point.  A month from now (April 1) the traditional snow accumulation season will end, and I’ll provide a more comprehensive assessment of the status of the basin’s water supply.

What happened in February?

Total basin water storage was 28 million af (acre feet) on 29 February 2024 (Fig. 1). Since mid-December 2023, basin storage progressively increased bit by bit — by 32,000 af in February. The small value of the increase matters little; what matters is that basin storage did not decrease and hasn’t for the last 2.5 months. To date, reservoir storage is only 20% less than the peak storage at the end of the 2023 runoff season. This is a very small loss in relation to the rate at which the bounty of previous runoff years had been consumed. Nevertheless, conditions in the basin are comparable to conditions in early May 2021, a perilous situation.

Figure 1

Figure 1. Graph showing total basin reservoir storage and total storage in Lake Mead and Lake Powell since January 2021. This graph demonstrates the efficient retention of reservoir storage accomplished this year, the result of reductions in consumptive use and addition of winter precipitation. The black arrows indicate the last time reservoir storage matched current conditions.


Although basin storage has not changed, the distribution of storage within the basin has somewhat changed, with storage being systematically shifted downstream. The combined storage in federal units of the Colorado River Storage Project upstream from Lake Powell (Flaming Gorge, Navajo, Fontenelle, Blue Mesa, Morrow Point, and Crystal) peaked in mid-July 2023 at 5.8 million af, and steadily declined thereafter (Fig. 2). In February, the combined storage in these reservoirs declined an additional 79,000 af to 5.0 million af.

Figure 2

Figure 2. Graph showing total basin reservoir storage (solid blue line) and storage in the different parts of the watershed. Notably, storage in Lake Mead has steadily increased during the past 18 months, while storage in Lake Powell has fluctuated more. Storage in CRSP reservoirs upstream from Lake Powell has steadily decreased since summer 2023, but is larger today than during the previous 2 years.

Similarly, storage in Lake Powell peaked in mid-July 2023 at 9.7 million af, but was 7.9 million af at the end of February 2024. Storage in Lake Powell declined by 203,000 af in February. Conversely, storage in Lake Mead reached its nadir in August 2022 at 7.0 million af and has steadily increased thereafter to 9.7 million af at the end of February. Storage in Lake Mead increased by 310,000 af in February with most of that water coming from Lake Powell releases. Today, Lake Mead has 1.8 million af more water than does Lake Powell. The combined storage in the two reservoirs was 17.7 million af on 29 February, 109,000 af more than at the end of January.

Let’s hope for another good month of precipitation in March.


Stanley Crawford on the first water of spring

A winding irrigation ditch with a dirt road, trees, and mountains in the background, surrounded by farm fields not yet green.

First water in the old Jarales acequia, along New Mexico’s Middle Rio Grande, March 2024

Six days later, Lázaro Quintana, the mayordomo, opened the headgate and sent the first water of the new season down the five-mile long ditch, empty since the November before.

When the brown water finally arrived four hours later at the bridge, the tip of its foamy tongue was bearing along a small plum branch that a ditch worker had thrown on the upper side of the ditch bank, where the wind had blown it back down into the channel. It was one of many such prunings that Lázaro had inevitably failed to catch with his rake, but it was the first one to snag on the cottonwood sapling at the mouth of the small bridge. The splayed structure of its short branches provided a fine armature for the next arrival, some plastic wrap and a Styrofoam meat tray that the village dogs had fished out of a Clapp garbage bag. Next came a small tumbleweed, or half of one because a passing car had clipped it while it was blowing across the highway into the ditch. Next, in short order, a flotilla of Greenpeace pamphlets and bumper stickers bearing images of whales and dolphins and seals and sea birds in blues and greens, just beneath the surface of the brown water, some of which flattened themselves against the sinking tumbleweed and plastic wrap and the prongs of the plum branch.

The late Stanley Crawford, from his loving book Village.

Dad’s hammer

A wooden handled tack hammer and a crescent wrench, hanging on a peg board.

Dad’s hammer

Trying to remove a gizmo from my bike yesterday that was stuck because of a stripped hex bolt, I had occasion to root around L’s tools for a hammer, something small and precise that I could use to carefully tap the gizmo loose.

I remember this hammer from my childhood. It was Dad’s. Lissa reminded me that it was a tack hammer. Dad, an artist, used it for mounting canvas on his frames. One end was magnetic, to hold the tacks. (My sister, Lisa, remembered this detail.)

Using it was a happy memory. Dad’s been gone for a dozen years, but his art and a bunch of his little things remain with us.

Today would have been his 106th birthday.

Tracking flows on New Mexico’s Middle Rio Grande as irrigation season begins

Graph of rising spring flows on the Rio Grande.

Early spring base flows, before snowmelt begins.

It’s hard to tell this morning what yesterday’s howling dry winds did to our snowpack. It’s the sort of thing that can cause sublimation, which means the loss of snow straight to atmospheric drying without ever having a chance to melt and make it to the rivers. It looks like some snow may have fallen in the high country, so maybe we’re OK?

My new Fleck-o-Graph for San Felipe, with the added median lines for 1981-2000 and 2001-present (thanks, Kyle!) shows a pretty “normal” year so far for the 21st century, and also makes clear how anomalously wet the 1980s and ’90s were. That red line is really important, because it documents a sort of “cultural memory” – a period of population growth in New Mexico during an unusually wet time.

I think by now we’ve adjusted our priors, but the 1980s and ’90s linger in the background.

Watching the water spread across the Middle Rio Grande Valley Floor

A dry irrigation ditch, brown, lined with trees and homes and a horse corral

An irrigation ditch in Alameda, on Albuquerque north end, awaiting first water. February 2024

I feel this morning a bit like a kid watching the NORAD map of Santa on his global travels, as I hit “reload” on the Middle Rio Grande Conservancy District’s new gaging data page.

The district opened the diversion gates early this morning at Cochiti Dam, at the head of what we call New Mexico’s “Middle Rio Grande Valley.”

As I write, the water’s made it through old Spanish colonial village of Peña Blanca and onto Kewa Pueblo, the Native American community that has lived there from time immemorial.

I spent yesterday on a leisurely bike ride up the valley with a friend, starting at downtown Albuquerque and following a mix of ditchbanks and Guadalupe Trail, road that stops and starts and zigs and zags in an urban design – “undesign?” – well suited to leisurely rides.

We spent a good stretch of the ride on the Griegos Drain, built in the 1930s to drain the swamps that were making the valley increasingly ill-suited to modernity. The upper end of the ride took us straight up the old flood path that the river would have taken in high flow years, before the community came together to build levees and drains and the consolidated irrigation system we’d been riding, things that made modern Albuquerque possible.

I love this moment of promise. Here’s the final two paragraphs of our forthcoming book.

Joey Trujillo, manager of a team of Conservancy District ditchriders, a product of Albuquerque’s South Valley who grew up playing in ditches and now managed them, stood next to a newly flowing Albuquerque Main canal one March day in the early 2000s, describing the joy of watching the arrival of the first water of spring. The swamps and the flood menace were one that warm spring day. The trees bore the promise of spring, buds not yet green, as the dry ditch took its first drink.

It’s like you can feel the valley breathing in, he said.

Ignoring an Inconvenient Colorado River Basin Risk

Ringside seats to the decline of Lake Mead

Sometimes all we can do is sit and watch and wonder

By John Fleck

It is agonizing to watch this, but here we are.

With efforts by the Colorado River Basin states to craft an agreement to share the river’s water skidding, brakes screeching, toward a cliff, we appear on the brink of repeating the disastrous mistake the authors of the Colorado River Compact made a century ago: ignoring inconvenient truths about the risks we face, washing away genuine uncertainties with convenient talking points.

As Eric Kuhn carefully documented in a post here yesterday, there is once again a genuine risk that we will ignore inconvenient truths about a huge uncertainty in our understanding of how much water the river can offer us, and for whom. We are pretending that an uncertainty literally at the scale of millions of acre feet in how we measure and manage water does not exist.

A masterful Upper Colorado River Basin public relations blitz, led by the Colorado Water Conservation Board, would have us believe one set of numbers about the river’s future, a set of numbers that has given Upper Basin water users comfort that they can sit tight and blame others for the river’s woes.

But as Eric’s analysis showed, there are hidden assumptions behind the Upper Basin’s numbers – assumptions that hide a genuine and irreducible uncertainty. The uncertainty is irreducible because more than a century after the adoption of the Colorado River Compact, there is still no agreed upon definition of how to measure the use of water. As Eric wrote, these are questions “with enormous potential impacts on the allocation and distribution of the shrinking Colorado River – questions we have avoided dealing with by draining the Basin’s reservoirs. We no longer have that option.”

Arithmetic and Law

Eric is a master of the arcane and wonky details of the interface between Colorado River law and hydrology, and I commend you to his analysis – it rewards a careful read. But Eric once described my role in our collaboration as “dewonkifying”, so let me try to put this in simpler terms.

The 1922 Colorado River Compact based its allocations on “beneficial consumptive use”. But the phrase was never defined, and the definitions ended up bitterly contested in the decades that followed. It remains undefined to this day. Or rather, there are two competing definitions that yield very different results.

Each definition makes intuitive sense, and at first glance they look puzzlingly similar. But at the scale of the Colorado River Basin they yield very different results that have become a critical piece of the current basin management debate.

Method A is based on the collective amount of water communities take from the river, minus the amount they return – “diversions less return flows.”

Method B is based on the ultimate impact of that use on the Colorado River downstream of the use – for the Upper Basin, for example, at Lee Ferry, or for Arizona at the confluence of the Gila and the Colorado near Yuma. This is the “stream depletion theory”.

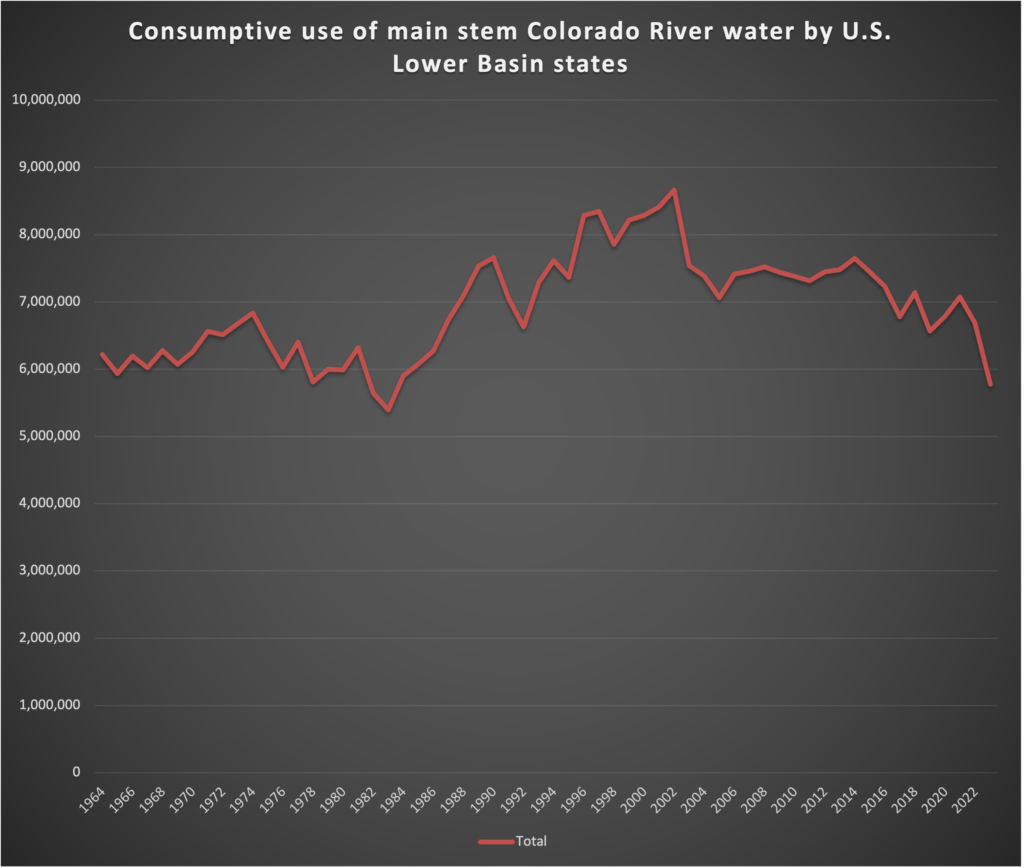
Those might sound so similar that the differences are trivial. And at localized scales they are. But, as Eric explained in yesterday’s post, with a classically Eric Kuhn working out of the mathematical details (I love collaborating with this guy – he shows his work!) at the scale of the Lower Colorado River Basin the differences amount to nearly 2 million acre feet of water.

Under Method A, Lower Basin use is more than 10.1 million acre feet per year, well above its Colorado River Compact allocation of 8.5 million acre feet. This is the methodology the Colorado Water Conservation Board staff used in its now-famous PowerPoint slide purporting to demonstrate that the  Lower Basin is using more than its legally allotted share of the Colorado.

But under Method B, Lower Basin use is some 8.3 million acre feet – less than its Compact allocation. Importantly, Method B is the method adopted by the Upper Basin Compact, and therefore the method used in the Upper Basin’s management of its share of the river.

Let’s Be Honest About the Uncertainties

To be clear, Eric and I are not arguing in favor of A or B. We are arguing, as we did in our book Science be Dammed (we spent chunks of three chapters on this question), that the lack of an agreement over the definition of “beneficial consumptive use” remains a genuine and important unresolved uncertainty in the Law of the River, and our discussions of the future management of the Colorado River need to acknowledge that uncertainty, not pretend that it does not exist.

This is what I, as a stakeholder whose community depends on the Colorado River, expect of those leading the interstate effort – public honesty about the genuine risks and uncertainties we face.


On the Colorado River, there are no Simple Disputes

By Eric Kuhn

One of the commentors to our January 19th, 2024, blog post titled “Are We headed for the First Colorado River Compact Tripwire?” – John C. (who, by-the-way runs a very talented water resources engineering firm) raised several finer points to explore further:

The first point deals with obligations of each Basin to contribute water needed to meet U.S. obligations to Mexico under the 1944 Treaty. The second deals with the question of how to measure, and therefore manage, in the context of overall Colorado River Basin management, the use of tributary water in the Lower Basin. Both represent unresolved legal questions with enormous potential impacts on the allocation and distribution of the shrinking Colorado River – questions we have avoided dealing with by draining the Basin’s reservoirs. We no longer have that option.

The two issues have been disputed for decades. They are, of course, totally inter-related, and when one peels back the layers of each, the problems get so complicated that the only real solution may be for the Basin’s states and other stakeholders to ignore their past positions and grievances and negotiate a river management approach that works on the river we have today, even if that means changes to the foundation of the Law of the River, the 1922 Compact.

Mexico Obligation

The different interpretations of the Upper Basin’s delivery obligations to Mexico under Article III(c) are well understood throughout the Basin. III(c) says that water for Mexico should be provided from “surplus”. If there is no surplus, the Upper and Lower Basins much each provide half the necessary water. But there has never been agreement on what that language means in practice. This unresolved uncertainty has enormous implications for how much water is available to each basin in the future.

The Lower Division States take the position that there’s no current “surplus,” as defined by Article III (c), thus the Upper Division States must deliver at Lee Ferry 50% of however much water is required to be delivered under the Treaty. The annual delivery is normally 1.5 maf/year, but under either the “extraordinary drought” provision of the Treaty, or Minutes, it could be less. In 2023, it was 1.4 maf.

The Lower Division States’ position would dictate an average annual delivery of 8.25 maf/year at Lee Ferry, 7.5 maf under Article III(d) + 750,000 af under Article III(c). The 8.25 maf includes an average contribution of 20,000 af/year from the Paria River and would be adjusted for the occasional annual delivery of less than 1.5 maf. Veterans of the negotiations that led to the 2007 Interim Guidelines will recall that Arizona’s Herb Guenther always brought with him to the meetings a posterboard sign with “8.25” written on it.

Going back to the 1970 decision by the Secretary of the Interior to set the “minimum objective release” from Glen Canyon Dam at 8.23 maf/year, the Upper Division States have consistently taken the position that their annual obligation Mexico has never been formally defined and, whatever it is, it is not 750,000 af/year, every year. While they vigorously complained, they never chose to formally challenge the issue in court or in Congress, perhaps because they concluded that they couldn’t show that any of their interests were injured. Today, based on post-2000 hydrology, that dynamic may have fundamentally changed.

The basic position of each basin has not changed. If anything, because the stakes are much higher, the positions have hardened. In a December 20, 2022, scoping letter to Reclamation, Arizona’s Tom Buschatzke, and Ted Cooke, wrote: “Article III(d) and (c) prohibits the Upper Division States from depleting the flow of the river at Lee Ferry below a rolling 10-year aggregate of 75 maf plus one-half of the Mexico delivery obligation. With reduced releases from Glen Canyon Dam potentially analyzed under the SEIS, if the 10-year rolling aggregate falls below the required aggregate volume, the Upper Division States could be subject to a “Compact call” that would require a reduction in consumptive use in the Upper Basin.  In footnote 1, they add “A “surplus” currently does not exist because natural flows in the Colorado River have not exceeded 16 maf in the past 10 years.”  In their August 15, 2023, scoping letter, the three Lower Division States write: “The Post-2026 EIS must analyze whether alternatives are consistent with the 1922 Colorado River Compact non-depletion obligations and delivery obligations to Mexico. Alternatives should include actions necessary to ensure compliance with such obligations.”

The Upper Division States are equally adamant that because of overuse in the Lower Basin, they currently have no annual obligation to Mexico under Article III(c). Note that I used the term “Lower Basin” because under the 1922 Compact, the Lower Basin includes the upper Gila River in New Mexico, where uses are small, Kanab Creek in Utah and Arizona, again uses are small, and the Virgin River, shared by Nevada, Arizona, and Utah, where uses are not small. The Virgin River is the water supply for the rapidly growing St. George area.  As a state, Utah consumes the second largest amount of Lower Basin tributary water, about 150,000 af/year, albeit much less than Arizona.

In recent public presentations, Colorado Commissioner Becky Mitchell has stated that the Lower Basin’s total annual use, including tributaries and reservoir evaporation, were 10.5 maf in 2020, 10.8 maf in 2021, and 10.4 maf in 2022, far more than the Lower Basin’s compact apportionment (7.5 maf under Article III(a) plus 1.0 maf under Article III(b)). Their position is that the Lower Basin’s overuse is “surplus” water that must first be used to meet the 1944 Treaty obligations to Mexico before the Upper Division States have any obligation to Mexico, a position the Lower Division States do not agree with.

The situation is messy. As I explain below, Mitchell’s 10-plus million acre foot calculation is based on analysis that contains a hidden assumption about the correct way to measure water use, an assumption at odds with the method the Upper Basin has traditionally used to measure its own water use. But when one peels back the layers, it’s even messier. First, there is no agreement on whether the obligation of the Upper Division States to Mexico is calculated on an annual basis, a ten-year rolling aggregate basis, or something else (I’m in the something else camp). The predominant position the Upper Division States is, as mentioned in John’s comments, that the since the 1944 treaty provides for an annual delivery to Mexico (which can change), therefore, the obligation of the Upper Division States is determined annually. As can be seen by the language in the Arizona and Lower Division States letter, the Lower Basin states’ position is based on a ten-year rolling aggregate. The logic of this position is that the last sentence of Article III(c) states: “whenever necessary the States of the Upper Division shall deliver at Lee Ferry water to supply one-half of the deficiency so recognized in addition to that provided in paragraph (d).”  Paragraph (d) is a ten-year requirement; does it make sense to add an annual requirement to a ten-year requirement? Further, the data necessary to determine whether a deficiency exists (and thus the obligation of each basin) would not be available until well after the water year is over.

My reading of the reports of the compact commissioners, their Congressional testimony, and the minutes of both the 1922 and 1948 suggests a third possible alternative.  The negotiators of the 1922 Compact, the 1944 Treaty, and the 1948 Compact considered the surplus to be the difference between the average long-term natural flow of the river at the international boundary and 16 million acre-feet, the aggregate of the apportionments made by Articles III(a) and III(b). During the negotiations of the 1948 Compact, Colorado’s Royce Tipton and Arizona’s Charles Carson laid out the logic. Based on the comprehensive hydrologic analysis conducted by Reclamation (Appendix I of the 1947 Comprehensive Report), the estimated long-term natural flow below the confluence of the Colorado and Gila Rivers was 17.7 maf/year. Subtracting 16 maf left an average surplus of 1.7 maf, 1.5 maf for Mexico and about 200 kaf for surplus uses within the United States. Upper Division State officials argued that with this hydrology there was no deficiency. Colorado’s Tipton and Clifford Stone (its 1948 Compact Commissioner), however, did acknowledge that the location of the surplus was an important factor.

With their 1940s understanding of the river hydrology, the Upper Division States did not want the deficiency calculated either on an annual basis or a ten-year running average. They understood that in both cases, they would be required to deliver more water to Mexico than using the long-term average. Under an annual determination, there would be many years (~50%) when there was a deficiency. Under the ten-year rolling average, there would be long periods when it would be below 16 maf/year and there would be a deficiency (the 1930s drought period for example) but provided the long-term average was more than 17.5 maf/year, there would be no deficiency. Tipton also made the point that in the future, the construction of additional storage reservoirs (like Lake Powell) would effectively “equate” the river. Today’s problem with this approach is that in the 1940s, the basin’s water managers assumed a level of “stationarity” (future river flows can be predicted by what happened in the past) that because of climate change does not exist today.

An additional problem we have today is the calculation of the deficiency is based on the natural flow at the international border with Mexico, not Lee Ferry. Note that the Arizona letter states, “natural flows in the Colorado River have not exceeded 16 maf/year.” That statement is very likely true, but there are no data to back it up. Unlike Lee Ferry, there are no recent calculations of annual natural flows at the international border. There is no Colorado River system natural flow database. The existing database includes natural flows to Lee’s Ferry, but downstream to the Imperial Diversion Dam, Reclamation acknowledges that they have little confidence in these data and much of it is not based on reconstructed natural flows.  Importantly, the existing natural flow database does not include the Gila River system.

The last widely published estimate of natural flows at the international border was completed by the Bureau of Reclamation nearly eighty years ago (Appendix I). These data were used during the 1944 Treaty ratification hearings and, to a lesser extent, by the 1948 Compact negotiators. Appendix I shows an average natural flow at the border of 17.72 maf/year. At Lee Ferry, it was 16.41 maf/year (based on1898-1943). Assuming a similar relationship between the flows today, from 2000-2023 the estimated natural flow at the border, including the Gila, would be approximately 13.5 maf/year (12.44/16.41 x 17.72). Note, because of climate change, which appears to have a greater impact on the southern tributaries of the Colorado River system, the relationship may no longer be reasonable.

Updating the natural flow database to include the Gila River has been suggested by Upper Division State officials, but Arizona has historically objected. Clearly this would not be an easy task and there would be large uncertainties, especially estimating with any certainty natural losses on the Colorado River below Hoover Dam and on the Gila River from the Phoenix area to Yuma under today’s climatic conditions.

Lower Basin Tributary Use

The Gila River is also the central subject of John C.’s second comment that Arizona, California, and Nevada should be concerned that including mainstem consumptive uses, tributary consumptive uses (including those in Utah and New Mexico), reservoir evaporation, and maybe system losses, the Lower Basin total consumptive uses exceed its compact apportionment of 8.5 maf/year. Alternatively, Lower Basin tributary consumptive uses far exceed 1.0 million acre-feet – if one believes Article III(b) was intended to only cover Lower Basin tributaries.  The problem with this argument is that there is no 1922 Compact definition of “beneficial consumptive use” (the “commodity” the Compact apportions). This is especially important for the Lower Basin tributaries.

There are different interpretations among the states and between the basins of how “beneficial consumptive use” should be defined and therefore measured. Each has a strong legal argument in its favor. But their approaches result in vastly different numbers, and as my co-author John Fleck has written, “There’s not enough water for all the lawyers to be right.”

Article VI of 1948 Compact defines and provides a method measuring compact apportionments for the Upper Basin. The 1964 decree in Arizona v. California defines how to measure the mainstem apportionments made to the Lower Division States under the 1928 Boulder Canyon Project Act. Since the 1963 decision did not interpret the 1922 Compact and there is no Lower Basin Sub-Compact, there is no accepted or defined method for measuring 1922 Compact apportionments on the Lower Basin tributaries (and arguably the entire Lower Basin).  The methods used by the 1948 Compact and the 1964 Decree are very different. The 1964 Decree uses the concept of “diversions minus return flows.” It comes from the language of the Boulder Canyon Project Act. Stream losses and reservoir evaporation from Hoover Dam to the points of diversion are not considered a use, but rather a limitation on the available supply.

The 1948 Compact approach for defining and measuring consumptive use under Article VI is based on what was referred to as the “stream depletion” theory. Consumptive uses for the Upper Basin and for the individual states are measured as the net impact of man-made depletions on the natural (AKA virgin) flow of the Colorado River at Lee Ferry using the “input-output” method. The 1948 Compact gives the UCRC the authority to change the method by unanimous approval. The UCRC has instructed its staff to identify an alternative to the input-output method, so this may happen soon.  Article VI was one of the most debated and carefully written articles in the 1948 Compact. The negotiators had a clear objective in mind. They wanted to carefully define how to measure compact apportionments so that water made available for consumption through “salvage by use” would not count as compact apportioned use.

The issue of salvaged water was a major dispute among the basin states in the 1940s and 1950s. Simply put, salvaged water is water made available for use by the reduction of natural losses caused by the development of the river. The best example of salvage by use is Arizona’s Gila River. As the Gila River and its two major tributaries, the Salt and Verde Rivers, leave the rim country upstream of Phoenix, they have a combined average natural flow of over 2.0 maf/year (2.3 according to the 1947 report). As the river flows to its confluence at Yuma, in its natural state it loses about 1.0 maf/per year. By diverting and using the entirety of Gila River’s waters upstream, these losses are eliminated. Thus, Arizona can consume a million af/year more water than what the Gila River contributes to the natural flow of the Colorado River system.  Under the “stream depletion” theory, which was favored by Arizona and the Upper Division States, Arizona is only charged for a million acre-feet of 1922 Compact apportionment. Under California’s “diversions minus return flows” theory, also favored by Nevada, all 2+ maf/year of Arizona’s Gila River consumptive use would be charged as 1922 Compact apportionment.

The Upper Basin adopted the stream depletion theory during an era when the states were competing for every acre-foot possible. They thought could benefit by 400,000 -600,000 af per year. Simply put, in years when the water was physically available, the Upper Basin could consume 7.9 – 8.1 maf/year while only depleting the natural flow of the river at Lee Ferry by 7.5 maf/year (their compact apportionment). The negotiators never contemplated that 75 years later, the water available to the Upper Basin would be far less than 7.5 maf.

During the negotiations of the 1948 Upper Basin Compact, the decision to use the stream depletion theory was thoroughly debated. Wyoming’s legal advisor, W. J. Wehrli, warned the other states that using this definition would benefit the Lower Basin far more than the Upper Basin. Additionally, he noted that it could reduce the amount of surplus water under Article III(c), potentially increasing the obligation of the Upper Division States to Mexico. Wyoming ultimately fell in line and agreed to the Article VI definition. During the Congressional debate over the authorization of the Central Arizona Project, Upper Division State officials (primarily Tipton and Stone) testified in favor of the stream depletion theory, arguing that the negotiators of the 1922 Compact intended this method to measure apportionments. Note, the compact does not include a definition of “beneficial consumptive use,” they made their case based on an analysis of the minutes and the use of the term “depleted” in Article III(d).

The Upper Division States make a rhetorically powerful public argument that in the face of climate change, overuse in the Lower Basin is the central problem in the Colorado River Basin that must be solved to reach a sustainable future where water use, and the available supply are in balance. The argument is that when mainstem uses, reservoir evaporation, system conveyance losses, and tributary consumptive uses (in Arizona, Nevada, New Mexico, and Utah) are added together, the Lower Basin’s total use exceeds ten maf/year, perhaps as high as eleven maf/year. The Lower Basin’s compact apportionment, however, is only 8.5 maf/year (perhaps 7.5 maf/year depending on how Article III(b) is interpreted), resulting in an overuse of at least 1.5 maf/year. Such an overuse has major policy implications:

  • If the Lower Basin is overusing its compact entitlement, why should the Upper Basin, which is using far less than its apportionment, reduce its uses to help bring the system into balance?
  • Should the Lower Basin’s overuse be considered “surplus” water under Article III(c)? If so, should this surplus water be delivered to Mexico before the Upper Division States have any obligation to deliver half of the deficiency to Mexico?
  • These two questions have implications for Mexico, if the Lower Basin is overusing its compact apportionment, why should Mexico reduce its annual use?

The problem with the Upper Basin’s argument is that it’s based on the diversions less return flow theory. If the Lower Basin’s uses are calculated based on the stream depletion theory – the methodology the Upper Basin adopted in its own 1948 Upper Basin Compact, uses may not be greater than 8.5 maf/year.


Stream Depletion Diversions less Return Flows
Mainstem uses (a) 6.6 maf/year 6.6 maf/year
Reservoir Evaporation (b) 0.5 maf/year 0.86 maf/year
System Losses (c) 0 0.45 maf/year
Tributary Uses (d) 1.2 maf/year 2.2 maf/year
Total 8.3 maf/year 10.1 maf/year


Explanation:

a) Mainstem uses (deliveries from Hoover Dam) are very similar under both theories. Almost all mainstem uses are either fully consumptive or located low in the system. The average mainstem use by the Lower Division States over the last five years (2019-2023) is approximately 6.6 maf/year.

b) Under diversions less return flows the 0.86 maf/year is the average evaporation (2017-2021) from the December 2023 Reclamation study. Under the stream depletion theory, reservoir evaporation is calculated as surface evaporation less the natural losses in the inundation area that would have occurred had the reservoir not been built. This is how evaporation on Lake Powell is calculated. I estimated natural losses as .36 maf/year.

c) The 0.45 maf/year is from the December 2023 Reclamation study. Under the stream depletion theory, system losses are offset by salvaged water. As a practical matter, we have no idea how much salvaged water is currently generated on the mainstem below Hoover Dam, but we do know that the channel is much smaller today than it was before development. In 1945 during the Mexican Treaty ratification hearings, Colorado’s Royce Tipton estimated the number to be 400,000 af/year. I’ll assume they offset.

d)Under diversion less return flows, tributary uses are 2.2 maf/year, the latest data from the 2001-2005 Consumptive Uses and Losses and Report. Under the stream depletion theory, it’s reduced by 1.0 maf/year, the estimated salvage on the Gila River from the 1947 study. Because of climate change, losses today may be greater, but no data are available.

Thus, using the diversions less return flows theory, the Lower Basin is clearly using more than 8.5 maf/year, but under Upper Basin’s own stream depletion theory, it is not. Since the 1922 Compact neither defines nor prescribes a way to measure “beneficial consumptive use,” the basic question – “is the Lower Basin overusing its compact apportionment?” simply cannot be answered.

These disputes also point to the fundamental flaw with the states’ talking point that the 1922 Compact, the 1948 Upper Basin Compact, and the Mexican Treaty will serve as the foundation of the post-2026 operating rules. There is no agreement on what they say or mean. As the states continue their discussions with the goal of agreeing on a state proposal, they need to consider addressing the disputed compact issues in a straight-forward manner. Leaving these critical uncertainties for future generations to handle (like we have in the past) is no longer possible and asking the Supreme Court for a resolution will likely make matters worse, not better.


Trash day: mundane, yet remarkable

A city street, lined with trash cans, as seen from a mountain.

Note the trash cans.

Coming back from a morning hike in the Sandia Mountains above Albuquerque, I rounded a bend to see the scene above.

Note the trash cans lining the street. It is mundane, yet remarkable precisely because of how unremarkable it is. A large community of people has somehow come together, to act collectively, to get rid  of trash. This collective action, the getting-rid-of-trash stuff, depends on the broader collective action of building streets. It also requires a common shared understanding: “In my neighborhood, Monday is trash day.” Which rests on an even broader collective shared understanding – the notion of “Monday”, of a calendar.

The layers of such shared collective actions in this picture go on and on – the power lines running down the foothills behind me as I took he picture, the big water tanks and underground plumbing, the flood control dams at the mouths of each arroyo that allowed those houses to be there without being washed away.

Cities are amazing things, all the more so because of how mundane it all seems.

Opening the gates on the 2024 irrigation season in New Mexico’s Middle Rio Grande Valley

Irrigation ditch flanked by bare dirt roads and trees with no leaves. A small amount of brown water in the ditch.

First water in the Duranes Lateral, Albuquerque, New Mexico, March 2023

The Middle Rio Grande Conservancy District’s crews will usher the first water into the ditches of New Mexico’s middle valley Feb. 26, district Water Distribution Division Manager Matt Martinez told the district’s board at yesterday afternoon’s meeting.

The early water doesn’t go to irrigators right away. It’s needed to “charge” the system, wetting earthen ditches closely connected to the shallow aquifer, testing out the plumbing, finding any problem spots in the distribution system before the first water is diverted to yards, gardens, and crops later in March. Think of it as the middle valley irrigation equivalent of spring training baseball’s “pitchers and catchers report.”

What’s great about the baseball metaphor is the nervous optimism found in both.

Spring training is a time of optimism, the start of a great becoming that’s going to unfold over the coming spring, summer and fall – stiff arms, leafless trees, muddy ditchbank roads, a snowpack building but not yet subject to the vicissitudes of New Mexico’s warm April winds.

Pitchers and catchers can practice their rhythms, getting the signs down, working on the new breaking ball, clearing out the tumbleweeds that accumulated over the winter.

I love first water in the valley.

No Change in Reservoir Storage … and That’s Good News

By Jack Schmidt | February 12, 2024 (cross-posted from the Center for Colorado River Studies)

Nothing really changed in Colorado River Basin reservoir storage during January 2024. That is really good news as the basin prepares for the upcoming irrigation season.

1. Total basin water storage did not significantly change during January 2024 (Fig. 1, blue line). In fact, total basin storage increased a tiny bit—34,000 af (acre feet)—and was 28.0 million af on 31 January. Conditions in the basin remain comparable to conditions in spring 2021. There is no reason so stop our efforts to conserve reservoir storage!

Figure 1

Figure 1. Graph showing total basin storage in 46 reservoirs in the Colorado River basin between 1 January 2021 and 31 January 2024 (blue line). The black arrow points to the previous time when reservoir storage was at this amount. Total storage in Lake Mead and Lake Powell for the same period is shown by the orange line. Compiled from data downloaded at https://www.usbr.gov/uc/water/hydrodata/reservoir_data/site_map.html


2. Although the total storage has not changed, storage in specific reservoirs has been adjusted. Storage in CRSP reservoirs upstream from Lake Powell, including Fontenelle (Fig 2, green line) decreased by 109,000 af and has been decreasing since mid-summer 2023. Storage in Lake Powell (Fig. 2, gold line) decreased by 303,000 af. There was no significant change in storage in other Upper Basin reservoirs (Fig. 2., black line). In contrast, storage in Lake Mead (Fig. 2, purple line) increased by 368,000 af. On 31 January, active storage in Lake Mead exceeded active storage in Lake Powell by 1.27 maf; Lake Mead held 9.41 million af and Lake Powell held 8.14 million af. Storage in Lake Mead has slowly been increasing since mid-summer 2022.


Figure 2

Figure 2. Graph showing active reservoir storage in different parts of the Colorado River basin between 1 January 2021 and 31 January 2024. The category “other Upper Basin reservoirs” includes Granby, Dillon, McPhee, Strawberry, Starvation, Nighthorse, and 30 others. The category “CRSP reservoirs upstream from Lake Powell, and Fontenelle” includes Blue Mesa, Morrow Point, Crystal, Fontenelle, Flaming Gorge, and Navajo.


3. Basin reservoir storage continues to be depleted at an unprecedented low rate in comparison to the past decade (Fig. 3), as is also the case for the combined storage of Lake Mead and Lake Powell (Fig. 4). On 31 January 2024, the amount of basin storage gained by the 2023 snowmelt runoff had been reduced by 20%.

Figure 3

Figure 3. Graph showing the rate of reduction in basin-wide reservoir storage in each of the past ten years. The reduction in storage in 2023/2024 has been at a much slower rate than in other years. Each year that plots lower than 2023 (blue line) on this graph reflects a higher rate of loss in storage than the current year.


Figure 4

Figure 4. Graph showing the rate of reduction in the combined storage in Lake Mead and Lake Powell in each of the past ten years. The reduction in storage in 2023/24 has been slower than in any other recent year. Every year plots lower than 2023 (blue line) reflecting a higher rate of loss in storage than in this year.