NCDC March precipitation rankings
After a good start this year, New Mexico’s snowpack cratered in February and March. The month just completed, in fact, was the driest March on record in New Mexico. February and March combined were the second warmest
and second driest on record, a devastating combination for what had been shaping up to be a decent snowpack year. T
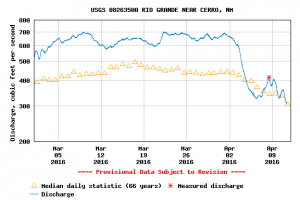
he preliminary April 1 median Rio Grande runoff forecast is now calling for 60 percent of the long term average at Otowi, the key measurement point as the river enters the most populous and water-using part of the state.
If the forecast holds, this would be the 15th year of below-average flows in the 17 years since 2000 (inclusive), and the 8th straight below average year. This period represents a significant test of the resilience of the system. How are we doing?
tl;dr
Short answer, looking at the three primary uses of water in the region:
- municipal water use: doing remarkably well
- agriculture: also, remarkably well (data below)
- nature: not so good
longer:
My University of New Mexico colleague (I still love saying that!) Melinda Harm Benson and a group of colleagues wrote a paper a couple of years ago applying a “resilience” framework to the Middle Rio Grande. Their definition of the term “resilience” is the ability of a system – in this case a “social-ecological system” with feedbacks between human and natural systems – to absorb a significant external shock while retaining its basic structure and function:
From a management perspective, promoting resilience involves (1) evaluation of the current trajectory of the system state, and (2) fostering the ability of the system to resist perturbations. The abilities to influence both of these factors are determined by a combination of attributes of both the social and the ecological aspects of the system. Systems with high adaptive capacity are able to re-configure themselves without significant changes to crucial functions, such as primary productivity, hydrological cycles, social relations, and economic prosperity.
I find this to be an incredibly useful framework – I don’t talk about it much directly in my book about the Colorado River Basin’s management, but Professor Benson’s help thinking through the issues (she had me come talk to one of her classes – that helps clarify the mind) provided an invaluable conceptual skeleton. It’s useful in part because it requires us to clarify which structures and functions we’re talking about. We then can look at the institutions through which we lumbering humans execute the “social” part of “social-ecological systems”.
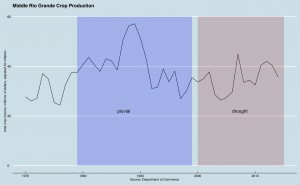
Middle Rio Grande crop productivity
The remarkable surprise for me, having watched Middle Rio Grande water management closely through this period of extended drought, is the extent to which the two key human systems built around water extraction have survived and even thrived during this period of less water. One useful measure of the success or failure of the region’s agriculture, for example, is the dollar value of crop production. The Department of Commerce publishes annual estimates of total crop sales (Table CA45 here), which I’ve summed up for the Middle Rio Grande’s four counties (Sandoval, Bernalillo, Valencia, Socorro) and adjusted for inflation here. The blue part is the last wet period, the ugly reddish purple is the drought. I haven’t done any fancy statistical tests here (Danger, journalist doing math!), but just eyeballing it you can’t see any particularly significant impact from drought on the sector of human use that depends the most on surface water for irrigation. A big part of this is efficiency in irrigation water application. During the wet times, farmers were more likely to simply dump a lot of water on their fields. As things dried up and allocation got scarcer, the farm water system has tightened up, but without a significant reduction in crop yields. Middle Rio Grande agriculture is a tiny segment of our economy, but by this measure it appears to have absorbed the shock of unprecedented drought and retained its basic structure and function. The adaptive capacity seems located in two places – on the farms themselves, and in the management of the irrigation district that delivers their water.
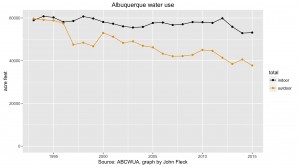
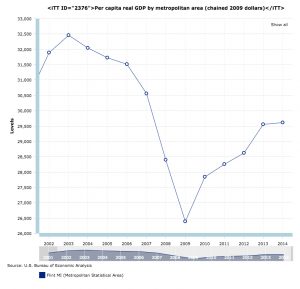
Albuquerque water use
The second major human-using water sector, municipal use, has also fared remarkably well during the drought. Total water use in Albuquerque, the region’s metropolitan core, has declined over the last 25 years, even as population has grown substantially (more background here on the 2o15 numbers shown to the left). As a result of the combination of a shift in supply management and conservation trends, Albuquerque’s overtaxed aquifer has risen 15 feet or more over the last decade (data here). Again, the adaptive capacity seems located in two places – among residents themselves via their conservation behavior, and in the water management institution that delivers their water.
Put another way, the rising aquifer means the mass balance of water in this region has increased during the worst drought on record while both agricultural and municipal water use sectors have continued to receive supplies sufficient for them to retain their basic structure and function. In both cases – ag and the municipal sector – we have stable institutions that have have demonstrated their ability to continue delivering the water supplies with general community consensus (or at least lack of significant conflict) around their approaches to managing supply.
The third important piece of the Middle Rio Grande’s water use, nature, is more complicated. The Rio Grande silvery minnow, the endangered species that has been our coal mine canary, depends on fish raised in hatcheries, so altered by human dams and diversions is the “natural” ecosystem in which the little fish evolved. The Endangered Species Act requires us to try to keep alive a fish that evolved in a meandering, braided desert river with large spring pulse flows in what is now a much more narrow, channelized river with much smaller spring pulse flows. Their is no stable institutional structure through which we as a community can come together to hash out our shared community values and then pursue them regarding what we want the river itself to be like, and what kind of natural system we might hope to preserve and enhance, and how we might manage water to achieve this. The best we have is the conflict-ridden Middle Rio Grande Endangered Species Collaborative Program, which has been unable in recent years to complete the most basic of regulatory tasks – extending the “biological opinion”, the basic Endangered Species Act regulatory document, which expired in 2013. This is one of the most interesting questions raised by resilience theory – where do you draw the boundaries around the systems you’re talking about? I think it’s fair to say that the riparian ecosystem has not retained its basic structure and function, and our institutions have not been up to the task of responding.
There remain interesting questions. Have the changes in water management that have allowed us to manage nearly two decades of drought merely taken the slack out of the system, making us more vulnerable to future shocks, especially from climate change? In other words, is the success I describe above not really a demonstration of resilience, but rather a hardening that in the long run leaves us even less resilient to future shock? Is our manhandling of the ecosystem weakening future resilience? Have I drawn the boundaries in the wrong place – maybe we’ve succeeded here in the Middle Rio Grande at the expense of folks upstream or downstream?