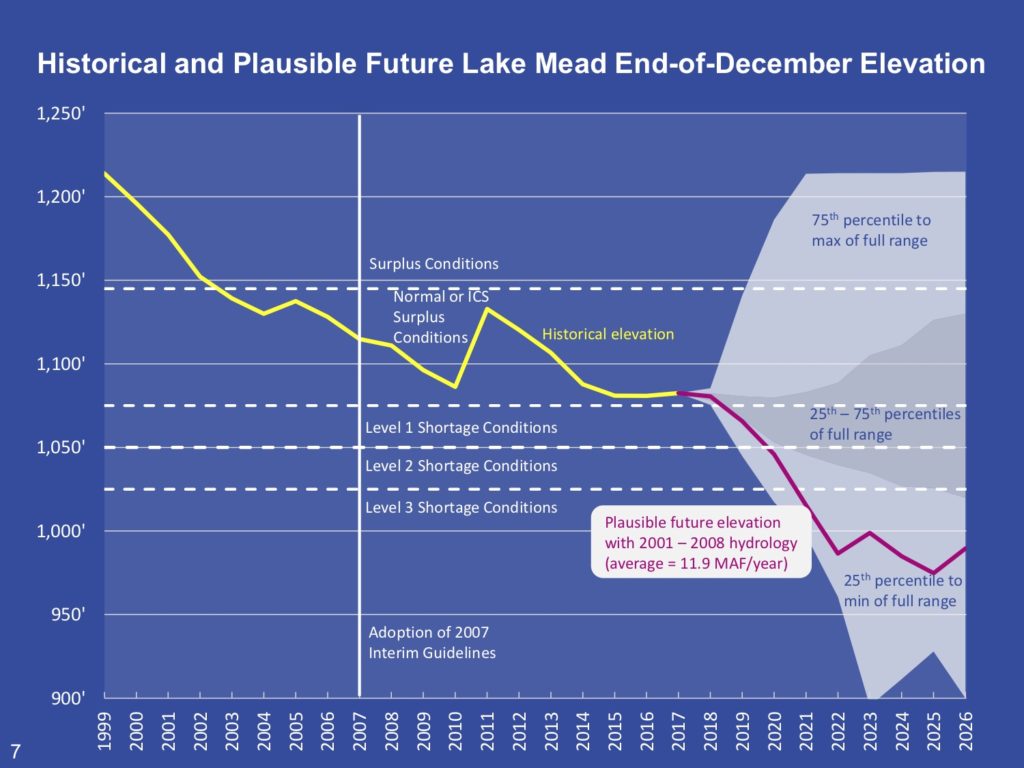
Speaking last week before the Imperial Irrigation District board, Reclamation Commissioner Brenda Burman showed this remarkable slide. It is remarkable for obvious reasons – it shows how easily we could crash Lake Mead! But it’s remarkable in a more subtle way that reflects a shift in our approach to the hydrologic analysis of the Colorado River’s flow, and how we think about risks, probabilities, and the worst case:

Crashing Lake Mead
Here’s how the Desert Sun’s Ian James, who was at the meeting, explained the first point:
Stressing the urgency of her appeal, Burman showed a chart with a range of possible reservoir levels for Lake Mead in the mid-2020s, including a worst-case scenario in which the reservoir falls to “dead pool” — too low for any water to flow over Hoover Dam. (emphasis added)
The second point is more subtle, involving the decisions embedded in the traditional representations of Lake Mead risk scenarios, and the choice Burman and the Bureau’s staff made in drawing that purply line to illustrate how bad things could get, how quickly.
For the book we’re writing, Eric Kuhn and I have been taking a deep dive into the history of water managers’ measurements of the Colorado River’s flow, and the use of those measurements in decision-making going back a century. One of the critical parameters chosen by decision makers is the “period of record” – what period of river flows do you use as the basis for your decisions?
The gray and light blue clouds shown in Burman’s diagram are a great example of how this works. Those represent the statistics of risk. The grayish bit in the middle, for example, represents a 25 percent risk of Lake Mead dropping below elevation 1,050 in 2020. (That would be really bad!) But what is the universe of possible futures on which that risk is calculated?
The answer (found by clicking on the “download table” link at the bottom of this page) is that the calculation is based on the statistics of Colorado River flow over the period 1906 to 2015. The Bureau this spring did a bunch of hairy calculations involving 3,850 different “futures”, all based on the foundational assumption that the statistics of the future will look something like the statistics of the past. Of course we know that’s not true in a general sense, because climate change mucks up such calculations (see Milly et. al, Stationarity Is Dead: Whither Water Management?). But even independent of climate change, we’ve known for a while that using 1906 to the present as a foundation for Colorado River water management decisions is problematic because of the anomalously wet first 25 years of that record.
To overcome that problem, water managers have been using a “stress test” hydrology, skipping forward to base this type of analysis on a shorter, more recent period of record that ignores some of the older anomalously wet, pre-climate change flows and begins to focus on the era of climate change (shoutout to my book collaborator Eric Kuhn and some other river thinkers in the Upper Basin for pioneering this clever hack).
The purply line on Burman’s slide demonstrates the use of a sort of “super stress test” hydrology as a communication tool, allowing us to focus our attention on a period of time untainted by the anomalously wet years of the early 20th century and fully tainted by the brutal impacts of climate change. It does so without having to invoke the freighted language of future climate change projections, pointing by way of analogy to a period of time in the experience of the people faced with making decisions today. This could happen because the hydrology we’re illustrating has happened in the recent past.
There’s a lot more going on this graph, especially the problems faced by Lake Powell in the purply line scenario. Burman’s purple line only crashes that badly and that fast because Lake Powell is also crashing at the same time. I’d like to come back to that tomorrow, because there’s some interesting new work by folks in the Upper Basin that can help us better visualize that as well.

I enjoy reading your musings on water in the SW, although I live in the Río Yaqui watershed in SE Arizona. Snowmelt run-off isn’t a factor here. I do worry about future water issues here in Cochise County, and wonder about the long-term viability of growing irrigated pecans and cotton in the northern areas of the county.
too low for any water to flow over Hoover Dam. It’s been through or under for a few years.
Pingback: Blog: How Lake Mead could crash | H2minusO Blog
Pingback: How to crash Lake Mead: Step 1 - crash Lake Powell - jfleck at inkstain
Pingback: How Lake Mead could crash | H2minusO Blog
John, nice post.
From the Desert Sun article you linked to: “In one recent study, scientists projected that warming will likely cause the river’s flow to decrease by 35 percent or more this century.”
Could the US southwest even survive as we know it today under such a decrease, do you think?
David –
We need to clarify “as we know it today”. With 80 percent of the water going to agriculture, the acreage devoted to irrigation would have to shrink. Urban populations would have to use a lot less water, but we know from the experience of Israel and Australia that cities can maintain their basic function and structure with far less water than they are using today.