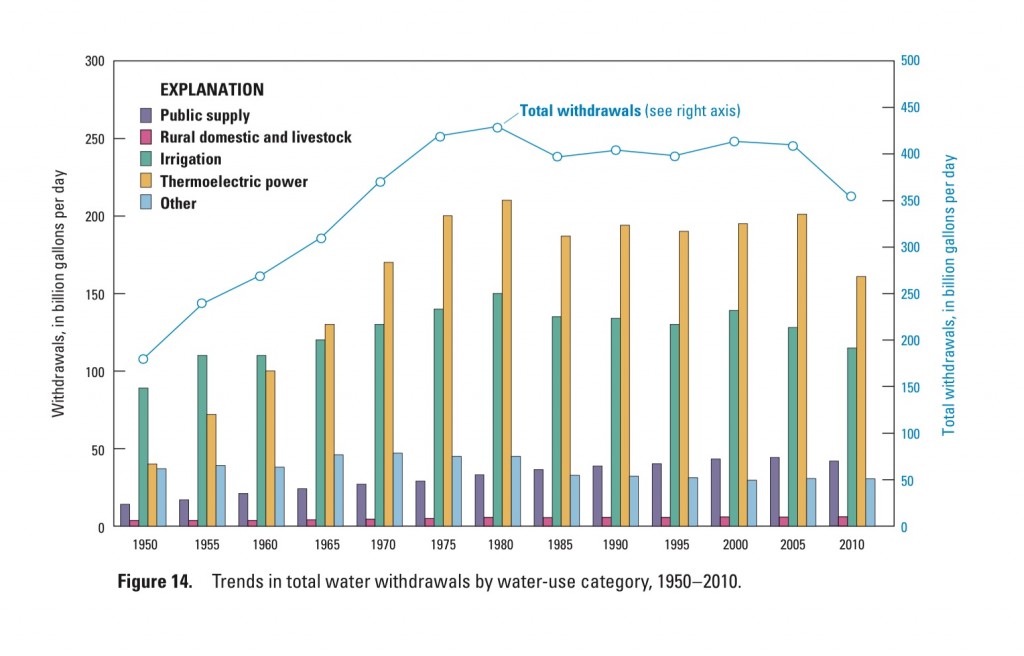
The latest USGS “Estimated Use of Water in the US” is out. It says we’re using less water. From 2005-10, a 13 percent drop. “Peak water” happened back in 1980:
There are lots of caveats. This analysis uses “withdrawals” rather than “consumptive use”. So if a power plant sucks up river water for cooling, that counts as “use” even if most of it is returned to the river. Farmers withdraw a lot, and return some via groundwater seepage and drains. The withdrawal-consumption distinction is really important for water policy, as I tried to explain here.
This big drop also spans the Economic Shitstorm of 2008. Part of the drop could be related to that.
I think a lot of work needs to be done by people smarter than I to sort out the implications of the above two caveats. But those notwithstanding, I think the new data supports the hypothesis (“slogan”?) I’ve been pushing recently: When one has less water, one uses less water. We’re pretty adaptable, we humans.


as the chart covers only until 2010 it is missing most of the “fracking boom” use of water, i wonder how much that will show up in the next update?
mostly, i see that the basic uses most critical (public supply, rural domestic and livestock, and other (does other include manufacturing?) is fairly flat to increasing.
so, yep, i agree with you, the more we had the more we used, and until we really get accurate numbers on groundwater the whole system is suspect, the real proof for a turnaround would be gradually rising groundwater levels for those using wells… i don’t expect to see that in my lifetime, but i’ll allow myself to be surprised as some few communities are rethinking their use.
Another factor that others have been pointed out is that we’ve “offshored” a lot of our water consumption (and pollution) by importing so many goods from China and elsewhere…