The Sheffield et al drought paper in Nature that I blogged quickly about a couple of days ago has triggered all kinds of fascinating discussion among folks in the southwestern US “drought community” (yes, there is such a thing). In brief, Sheffield and colleagues argue that a careful application of the Palmer Drought Severity Index suggests that there has not, in fact, been a discernable global increase in drought over the last 60 years.
There’s been some pushback from other researchers who have been using PDSI and coming to a somewhat different conclusion (see Aigua Dai here, for example). This suggests to me that, at the very least, PDSI’s sensitivity to the inputs that lead Dai and Sheffield to such different conclusions should give those of use who have been using it as something of a black box (I’m looking at me) some pause.
But more importantly for my purposes as a communicator, the discussion about the paper has served to reinforce the problem with the word “drought”, which is often used loosely (I’m looking at me) without care to delineate what sort of drought, with what sort of effects, we’re talking about. This recalls a 1985 review by Wilhite and Glantz that found 150 definitions. Here there be communication dragons.
Insofar as “drought” means variance on the dry side from the norm, but the norm in at least one key variable (temperature) is changing, what are we to with the statistics, and also with the word?
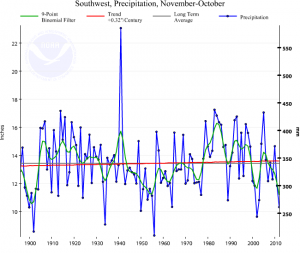
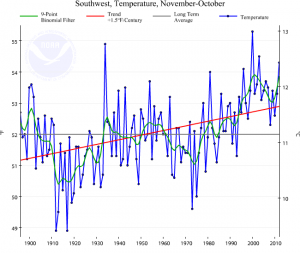
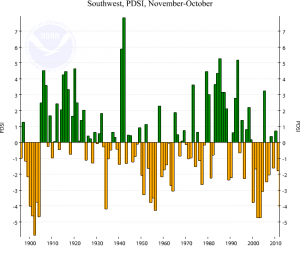
As a conversation starter, here’s some basic data on “drought” for the southwestern United States (Utah, Colorado, Arizona and New Mexico).
Numbers represent 12-month averages, ending October (the most recent data). Data courtesy NCDC.


I assume that the temp/precip plots are from data assembled by NCDC. If so, then ask NCDC to provide the raw data and the sites used to generate the graphs. I suspect that to NCDC, data continuity (long term daily data from the same sites) is not as important as using any site’s data that is available within a climate division for that days/week/month analysis. Fruit cake can be a confusing conglomeration of whatever was available (and still look good on the outside), but that doesn’t make it palatable to those who like their ingredients clearly labeled.
Ed – Thanks.
What would the likely impact be of using NCDC data over one that doesn’t have the problems you describe? Are the NCDC errors likely to be randomly distributed, and therefore cancel one another out for the sort of quick look I need? Or are they systematic and therefore biasing the data?
Pingback: Another Week of GW News, November 18, 2012 – A Few Things Ill Considered
Pingback: Stuff I wrote elsewhere: on drought metrics : jfleck at inkstain
Pingback: A Few Good Reads (11/27/12): To Rebuild or Not to Rebuild? Drought and Water Deals in the West. » Hydraulically Inclined