As the national media descends on the tiny Texas community of Spicewood Beach to capture the spectacle of water trucked to a thirsty town, I thought it might be worthwhile to revisit the question of what we have learned so far from the impact of the Texas drought.
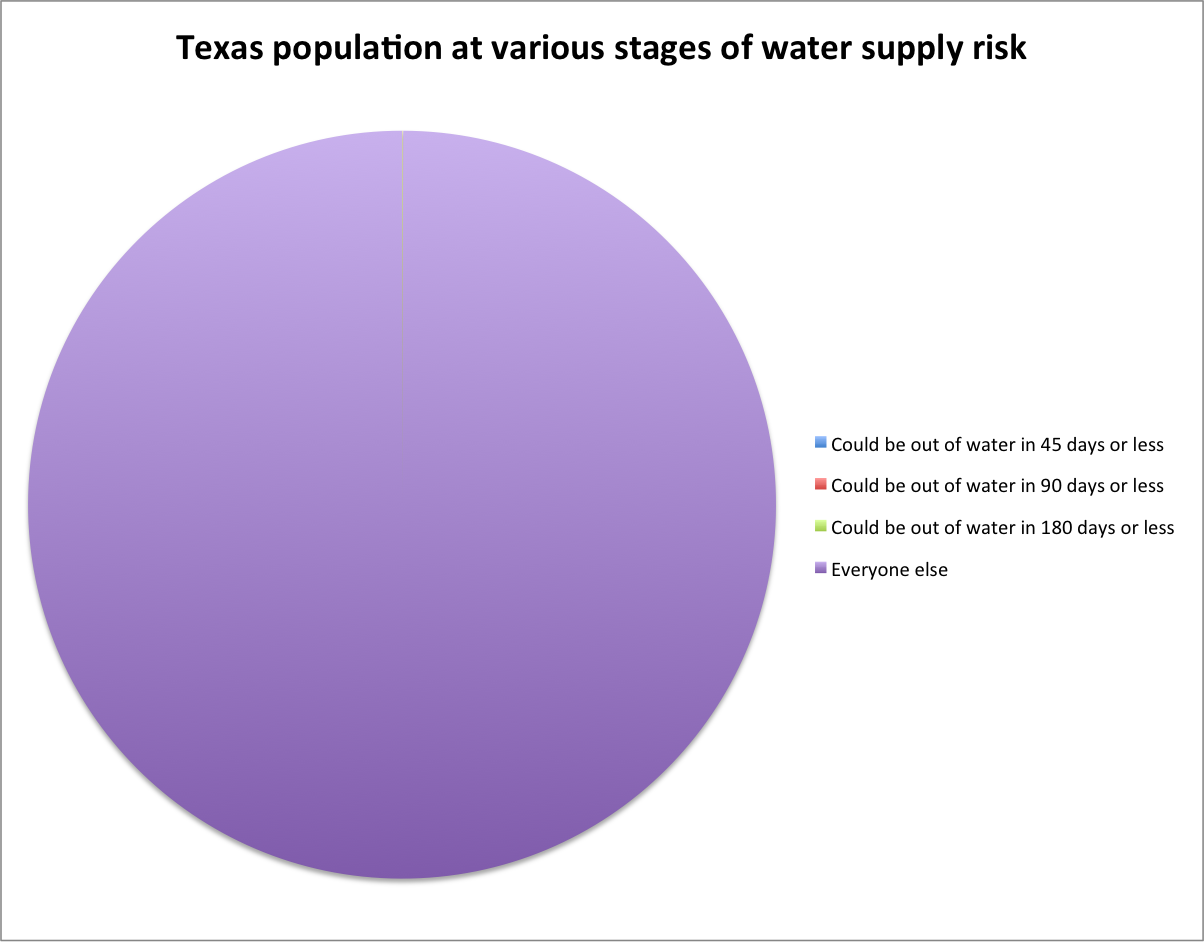
I tried to make a pie chart of the TCEQ data on water-short communities, but it proved unhelpful:
The difficulty here is that the software I’m using is incapable of making pie chart slices tiny enough to delineate the at-high-risk population from everyone else.
The folks in Spicewood Beach (population 1,296) and the other communities standing at the edge of the water supply cliff (2,871 who could be out of water in 45 days, another 3,162 if you extend that to 90 days, and another 7,441 if you extend that to 180 days) are in a heap of hurt, but most people in Texas (population 25,674,681) are not.
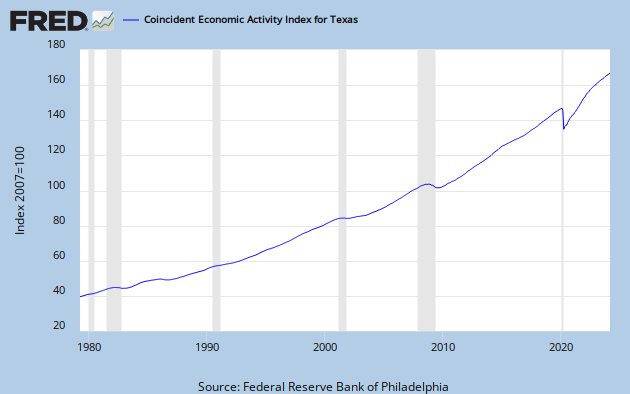
There’s no doubt that everyone else is in some level of hurt, but I’m struggling to think through how to conceptualize the effect of drought, if it is not running out of water. To be sure, there have been significant economic impacts, especially on the Texas agricultural economy. So I turned to the Philadelphia Fed’s state coincident economic index, which provides a nice single-number snapshot of the overall health of a state’s economy:

Texas state coincident economic index, graph courtesy St. Louis Fed
Whatever effect the drought has had in these terms seems to be lost in far larger economic forces.
For people like me who spend our time running around with our hair on fire trying to warn the public of America’s looming water shortages, Texas seems to me like an incredibly important case study about what happens when shortage finally arrives. So what’s it telling us?


I think it is an interesting question, but you want a graph that shows Texas’ economic trajectory before and after the drought. Your STL Fed graph doesn’t tell the story.
Best,
D
Dano –
Not sure I understand your question re the Fed graph. It clearly shows economic growth in Texas resuming in late 2009 (when most of the state was out of drought) and continuing its upward trajectory as the drought worsened. Here’s a drill-down:
http://research.stlouisfed.org/fred2/graph/?g=4IY
And here’s the table of drought severity over time:
http://droughtmonitor.unl.edu/DM_tables.htm?TX
Looked at another way, news stories have reported ag impact losses of $5 billion. I haven’t looked hard at those numbers, but they provide another crude guide at least. Texas has a ~$1 trillion economy. By that measure, the drought has cost Texas a half a percent of its Gross State Product. If you squint and look closely at the Coincident Economic Impact graph, you can see the slope of the curve decline ever so slightly in 2011. Maybe that’s the drought?
Well, what it shows is that areas within rich countries can absorb a modest amount of such damage without showing bad effects (via e.g. crop insurance, which acts to make the local economy whole) and that agriculture is no longer that big a component of the TX economy.
Also, apparently there has been something of a fire sale of TX cattle, and while that would seem to be a clear long-term economic loss it seems like it would show up as a plus in the short term.
Current events in Mexico might stand as a better object lesson.
Hi, John, I enjoy reading your website. This post about problems at places like Spicewood Beach made me think(!) so I put some of those thoughts at my own site: http://www.wateryfoundation.com/?p=6070
I suppose my main reaction is that the water supply problems of this small community, and probably even that of others, should not be over-interpreted.
Best regards,
Tom
Got it John – you argue that the tiny blip won’t show on that graph, essentially. I buy that.
Best,
D
“there have been significant economic impacts, especially on the Texas agricultural economy. So I turned to the Philadelphia Fed’s state coincident economic index,”
I missed this point the first time around (by not following the links), but David Appel also blogged on this and noted that this particular economic trend stat excludes farm income.
Precisely where you wouldn’t want to turn, then.
Steve – That’s a good point, but limited in terms of its effect on the issue. It’s not quite right to say the Coincident Economic Index excludes farm income. It’s built around a number of economic indicators (no-farm employment being the one that drew your attention), which are indexed to the states’ GDP (which *does* include ag income). The Philadelphia Fed, which creates the index monthly, acknowledges that the index “may be a less reliable indicator of economic activity in states whose economies are dominated by agriculture”, but that applies to the Dakotas and Nebraskas of the world, which have lots of ag relative to everything else (something in the neighborhood of 10 percent of GDP). Texas has a giant economy, of which ag is a relatively small portion (somewhere down in the 2 percent neighborhood). To be clear here, I’m not arguing that folks in the ag business aren’t being hurt by drought. I’m saying I’m not seeing evidence that Texas *as a whole* is suffering a lot, and I’m still wondering whether that lack of evidence of hurt is evidence of societal resilience to this climatic shock.
Fair enough, John, but if it’s only 2% of the economy there wouldn’t have been an expectation of seeing much of anything even if farm income had been included.
Re societal resilience, that’s a little different from economic resilience, albeit that we’re probably still talking about a pretty small fraction of the state population. But broadly speaking it would be a surprise to see much in a place with extensive insurance (financial and social) in place. Things will have to get a lot worse before that chnages.
This sure makes the effect on ranching sound like a major impact. But how is it quantified?
Steve – Thanks, this does sound like a major impact to this industry (and this has been happening here in New Mexico, too, as the story notes). It’s another one of those scale questions, though, as your question about quantification notes. Texas cattle is a $7.5 billion industry (again, in a $1 trillion-plus economy).
One thing I wonder about is what impact an overall agricultural contraction will have on the small towns of TX. These are for the most, I would assume, not included in that $7.5 billion figure, yet ultimately are largely dependent on the ag economy. If TX is anything like the area of north-central IA where I grew up, in the last century or so there have already been several waves of contraction associated with the ongoing mechanization/corporatization of farming, the most recent of which was during the ’70s (remember Farm Aid?) when what had been thriving small towns (in the sub-2000 pop. range) when I was a little kid ~1960 pretty much dried up and blew away. What was left by the mid-’80s (the last time I was back there to look) were a lot of partially depopulated towns with boarded-up business districts, closed schools (the remnant school-age population was bused), with a remaining and steadily downward-trending population largely composed of retirees and welfare recipients.
All of that occurred while the ag economy as a whole wasn’t taking hits, and regional centers (~5000+ populations) and cities seemed to benefit, but I can imagine that for TX an overall contraction of the ag economy, together with a possible End Football Event due to too-warm temps in the late summer and fall, would have a huge social and political impact.
OTOH the urban population, including the rural refugees, might just double down on hats, guns, god and reactionary politics. Re football, I expect they may just change the season to winter/spring, but watch them try to do it without admitting that there’s such a thing as anthropogenic climate change.
Pingback: Sizing up Texas drought response : jfleck at inkstain