By John Fleck and Jack Schmidt

Stable isn’t good enough.
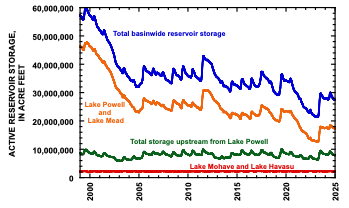
Preliminary year-end Colorado River numbers are stark. Total basin-wide storage for the last two years has stabilized, oscillating between 30 and 27 maf (million acre-feet), where storage sits at the start of 2025[1]. That is lower than any sustained period since the River’s reservoirs were built (Fig. 1). Stable is better than declining, but we did not succeed in rebuilding reservoir storage during 2024’s excellent snowpack but modest inflow. Although reservoir storage significantly increased after the gangbuster 2023 snowmelt year, we have not protected the storage gained in 2024 when inflow to Lake Powell was ~85% of normal from a 130% of normal snowpack. We can’t rely on frequent repeats of 2023; we must do better at increasing storage in modest inflow years like 2024.
Why is this happening?

Less water.
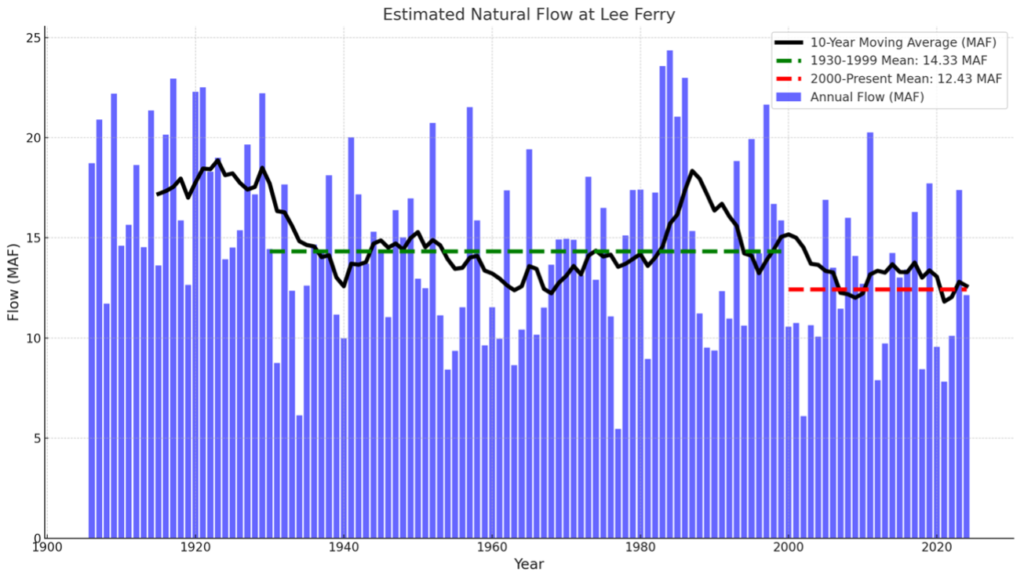
The phrase “the new normal” can be misleading, suggesting a new, more stable state for the climate. It’s not gonna be stable. But by one reasonable measure – total estimated natural flow in the Colorado River at Lees Ferry – Calendar Year 2024 was typical of the first quarter of the 21st century, with a preliminary estimate of 12.1 million acre-feet “natural flow.” Thus, the calendar year average annual natural flow at Lees Ferry between 2000 and 2024 has been 12.4 maf/yr, down from 14.3 maf for the period 1930-1999. An additional 770,000 af/yr in side inflows between Lees Ferry and Lake Mead add to the available water supply[2].
That we made the cuts needed to stabilize reservoir levels with a natural flow at Lees Ferry as low as 12.1maf would have been a substantial achievement in the wetter “before times.” Now, it’s table stakes. The most important point is that we absolutely did not rebuild storage in 2024, despite a 130 percent snowpack. We must do better in reducing total basin consumptive use.
Once again in 2024, we saw substantial water use reductions among the states of the Lower Colorado River Basin. Total U.S. Lower Basin main stem use of 6.08 maf is the lowest since 1985 (meaning the lowest since the Central Arizona Project came on line). California’s use, based on preliminary numbers published by Reclamation seems to be the lowest since 1950, and use by the Imperial Irrigation District seems to be the absolute lowest in a dataset that goes back to 1941. These are important achievements, to be celebrated.
With regard to the other two major U.S. areas of use – Lower Basin tributaries and the Upper Basin as a whole – we have no idea what 2024 consumptive use was. This is a problem. Lower Basin main stem use is quantified through Reclamation’s annual accounting reports and reported on a nearly daily basis during the course of the water year. River flows and reservoir levels across the basin are similarly reported in public, transparent ways. That’s how we’re able to provide the data you see above. Anyone can download and crunch the numbers. The general public can’t readily do that for consumptive use in the Upper Basin or Lower Basin tributaries.
As Elinor Ostrom noted in her classic book Governing the Commons, shared understanding of the resource is crucial to successful water management. Increasingly, areas of uncertainty have become contested ground, as the genuine technical uncertainties collide with the motivated reasoning of political actors across the basin.
With respect to the Upper Basin, we note that the rhetoric that Upper Basin water users suffer shortages in dry years has shifted to a broader claim that Upper Basin users always suffer shortages. We quote here from the Upper Basin states’ January 2 press release: “There are acute hydrologic shortages in the Upper Basin every year – there simply isn’t enough water in any year to satisfy current needs in the Upper Basin every year. The Upper Basin has made uncompensated cuts to their water users every year for the past 24 years.” Some of the data to support this assertion was presented at the December 2024 UCRC meeting, and we look forward to a more complete and transparent accounting of these data, because these data are crucial to a robust Colorado River management discussion. The Upper Basin’s experience of “acute hydrologic shortages … every year” is exactly what John Wesley Powell described in 1878 in the first edition of The Arid Lands Report. Nothing has changed, and the challenge of agriculture throughout the watershed has been well known for 150 years. We also note that consumptive use data throughout the basin has not been integrated with the important findings of Richter et al (2024) who documented the proportion of water used by different agricultural sectors. They estimated that 55% of all Colorado River water use supplies livestock feed.
We leave a discussion of Lower Basin tributary use for another post but note that in both the cases of the Upper Basin use and Lower Basin tributary use, the numbers are entangled in the current Upper Basin-Lower Basin feud, which makes serious efforts to think about how to manage water at the Basin scale, rather than simply defending parochial interests, much more difficult. It is important that the general public not employed by a state or water agency, and therefore not beholden to local parochial interests, help the basin community as a whole navigate these technical issues.
Conclusion
The stable reservoir levels at the end of 2024, despite another year of deep Lower Basin water use reductions, should be cause for alarm. Deeper cuts are needed. But without a shared understanding of water use elsewhere in the basin, we’re flying blind.
[1] Basin-wide reservoir storage reached a peak of 29.7 maf on 13 July 2023 and was subsequently drawn down to 27.5 maf by mid-April 2024. Inflow from 2024 snowmelt rebounded basin-wide storage to 30.0 maf on 6 July 2024, and storage was subsequently drawn down to 27.4 maf by 31 December 2024. Retention of storage in Lake Mead and Lake Powell has been somewhat better during the same period. Combined storage in Lake Mead and Lake Powell peaked in mid-July 2023 at 18.0 maf, declined to 17.1 maf by mid-May 2024, increased to 18.5 maf on 8 July 2024, and was 17.3 maf on 31 December 2024. Thus, storage in the two largest reservoirs at year’s end was slightly greater than it was at its spring 2024 minimum just before storage increased when significant snowmelt reached Lake Powell.
[2] This estimate is calculated as the difference between annual flow measured just upstream from Diamond Creek in western Grand Canyon and measured at Lees Ferry.

Looks like we are repeating the 1950’s to about 1980 conditions all over again. Just the normal vicissitudes of climate. Looks like we have learned nothing all over again. Reminds of one day in 1979 when government attorneys tried to make fun of me when I pointed out that if the EB-Reservoir (Lake BM Hall) spilled it would be SJ Chama water over the spillway first. They responded by saying that the reservoir had never spilled. Then, lo and behold in the mid-1980’s it spilled two or three times. Vicissitudes. Recently the 100 year storm over the Peralta Canyon Watershed by the USACE was adjusted from 500 cfs to 5000 cfs. That is not a little change.
What was Mexico’s use in 2024 and how does it compare from a conservation perspective to the reductions in use by Az and Ca? Should we be asking Mx to cut more?
“More food, but less land and water for nature: unforeseen and substantial global increase in land and water usage” Chris Seijger, The Water Dissensus (January 15, 2025) https://www.water-alternatives.org/index.php/blog/ca
Food and Agriculture Organizations of the United Nations data https://www.fao.org/faostat/en/#home
The food systems countdown report 2024 – Summary https://openknowledge.fao.org/items/b279a3fd-04b3-4da9-8a40-4841b68c987a
“The stable reservoir levels at the end of 2024, despite another year of deep Lower Basin water use reductions, should be cause for alarm.”
Let’s call the Lower Basin reductions what they really are: The Lower Basin reducing its systemic over-use and getting their use in line with what they are actually entitled to. 6.08 MAF of consumptive use plus a rational and necessary allocation of system losses puts the LB right around 7.5 MAF/yr. Instead of cause for alarm, I would call it a welcome proof of concept for the Lower Basin: living within their compact entitlement results in system stability.