Courtesy Jack Schmidt, Utah State University
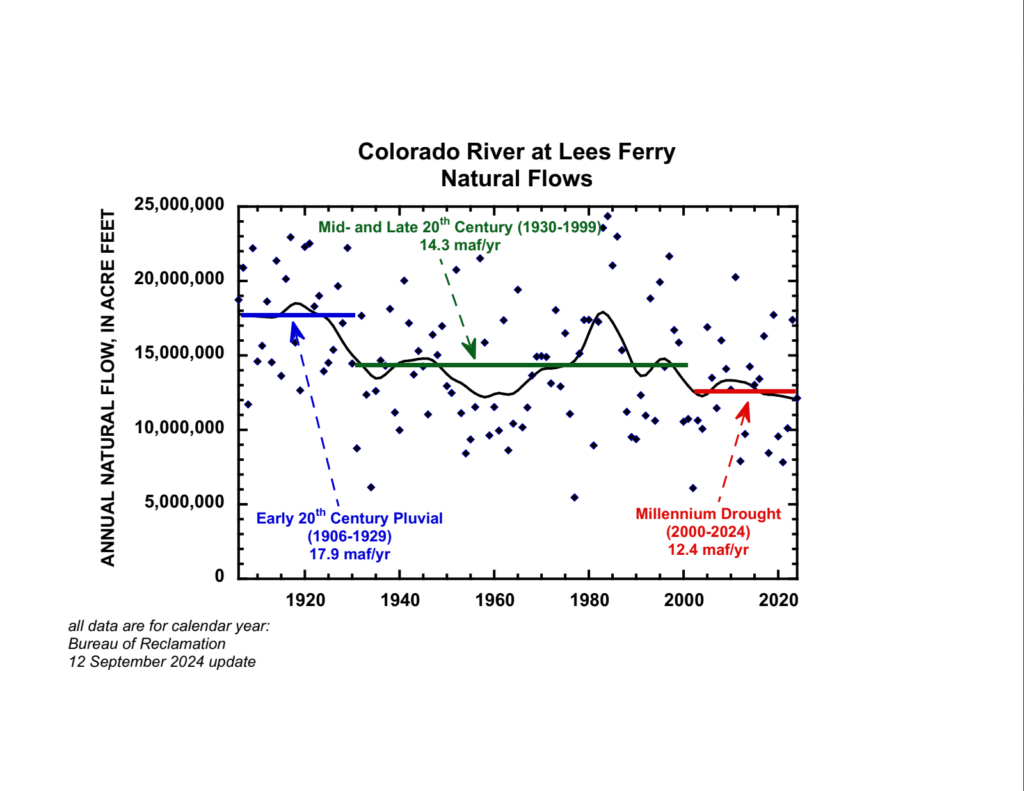
This version of the Colorado River graph, courtesy of Jack Schmidt, more clearly illustrates the narrative of the talk I’m giving later this week:
- Early 20th century pluvial, when we built the institutions
- Mid-century baseline, when we built all the dams and farms and cities
- Millennium drought, when we emptied the reservoirs

Yeah! Se3m like 50s through 80’s were just as bad. The vicissitudes of weather cycles. The sky isn’t falling.
Looks to me like stars scattered randomly in the night sky. One really needs to be a necromancer the derive any meaning to this data. Why not publish the R^2 (root mean square error) for this data. I think it is about 10%.
It would be better if you broke out the 80’s pluvial, and maybe the 90’s with it to show there has been a very wet period recently. This will also drop the mean for the 30’s through 70’s to show it was an even drier period than you are showing. That dry period didn’t matter as much because the river wasn’t fully developed but it was a warning there might not be enough water to keep developing the river, ie CAP and CRBPA. Since AZ ignored the warning we got the worst case scenario in 2002, a bad and sustained drought just as CAP and other CRBPA projects were coming online so the river was overdeveloped.
You seem to be goal seeking to show a river in steady decline. The 80’s run counter to that narrative. Global warming causing warming oceans and atmospheric rivers could offset the effects of rising temperatures on runoff leading to periods like the 80’s in the future.