Some data on alfalfa production

Update: Data here is from USDA, the “USGS” in the graphs is a typo in the code I used to generate them, which I’m too lazy to fix.

Line graph showing the trend of alfalfa acres harvested in New Mexico from 2000 to 2024. The x-axis represents the years, while the y-axis shows the number of acres harvested, starting from 0. The line is black with circular markers at each data point. A slight fluctuation in acres is observed, with values generally between 120,000 and 160,000 acres over the years. The bottom label reads: 'Data: USGS, Graph: John Fleck, Utton Center, University of New Mexico School of Law.'"

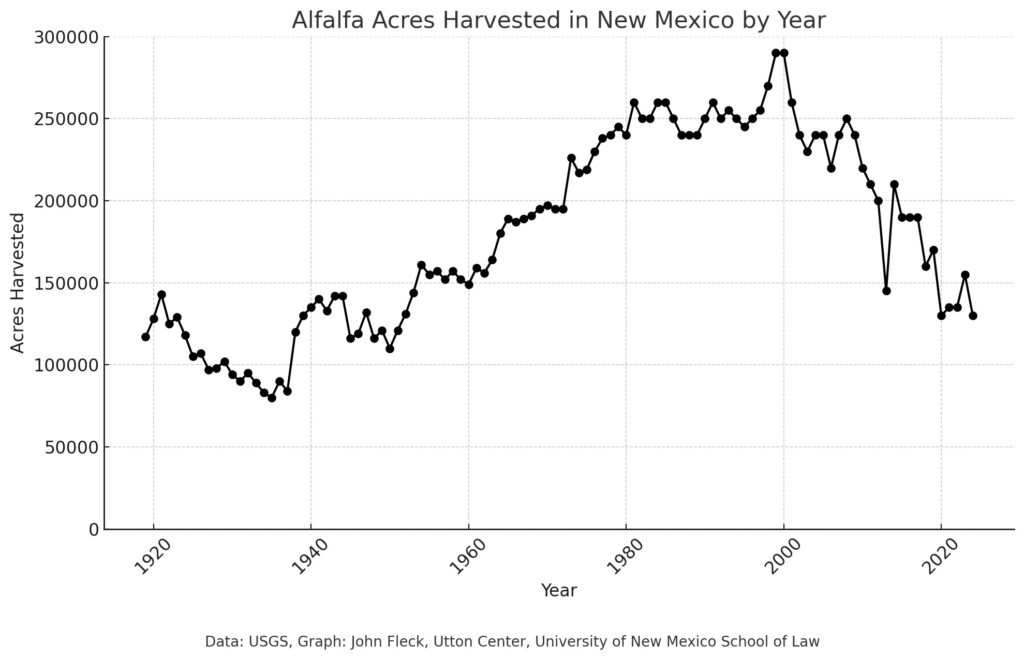
New Mexico alfalfa acreage is the lowest it’s been since the 1950s.

The U.S. Department of Agriculture’s 2024 estimate of alfalfa acreage in New Mexico, 130,000 acres, is the lowest it’s been since the 1950s. Acreage is down 55 percent since the peak at the turn of the century.

Here’s Arizona:

Graph showing rising alfalfa acreage in Arizona from 1919 to the present

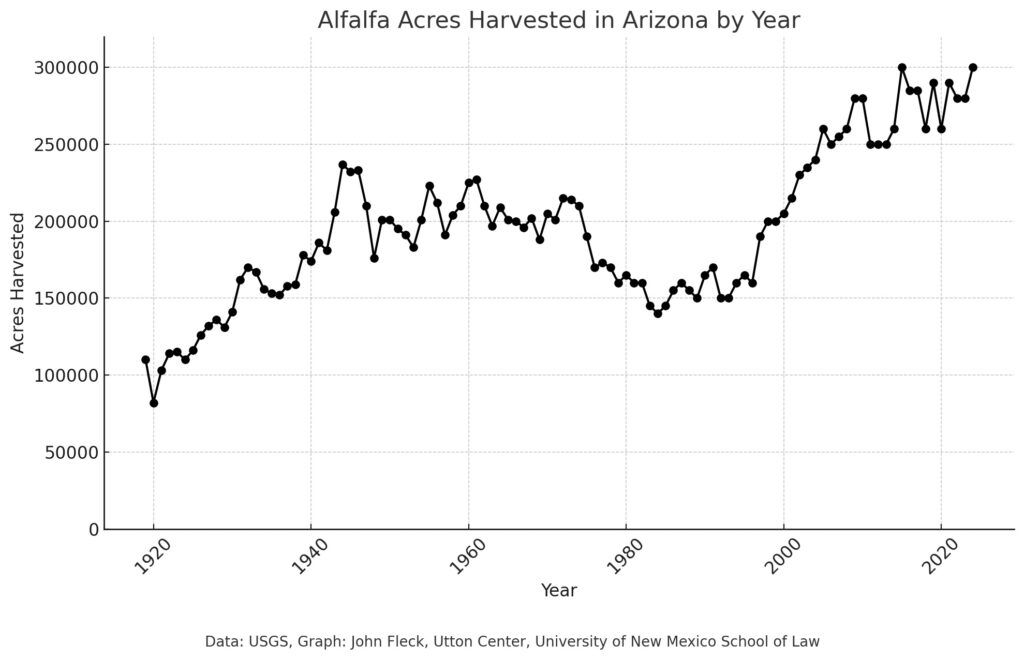
Different story for Arizona.

California:

Line graph showing declining alfalfa production in California

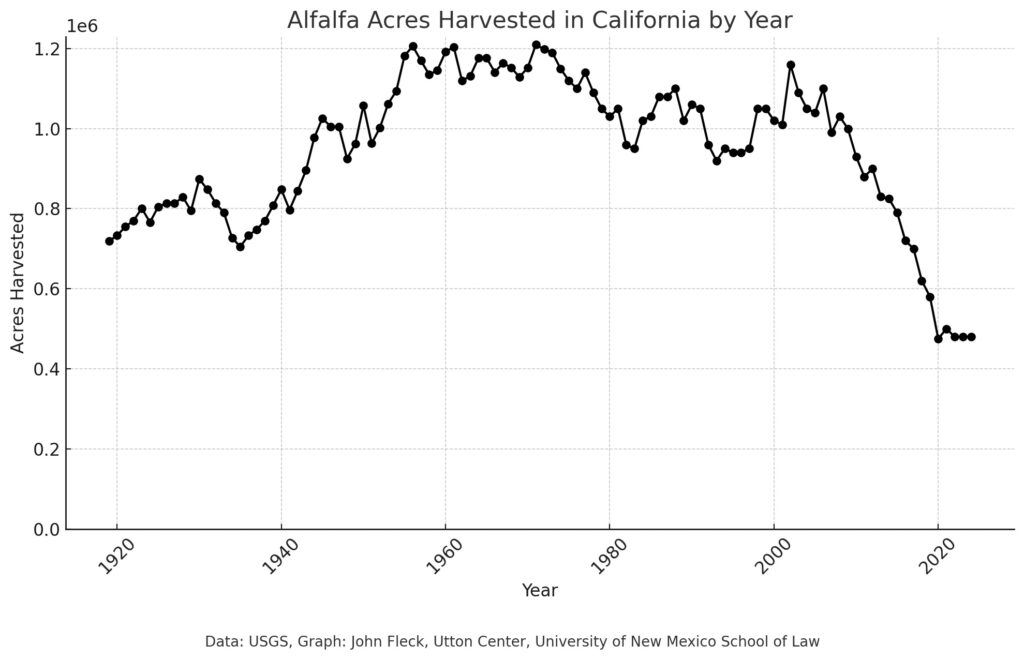
California, growing less alfalfa
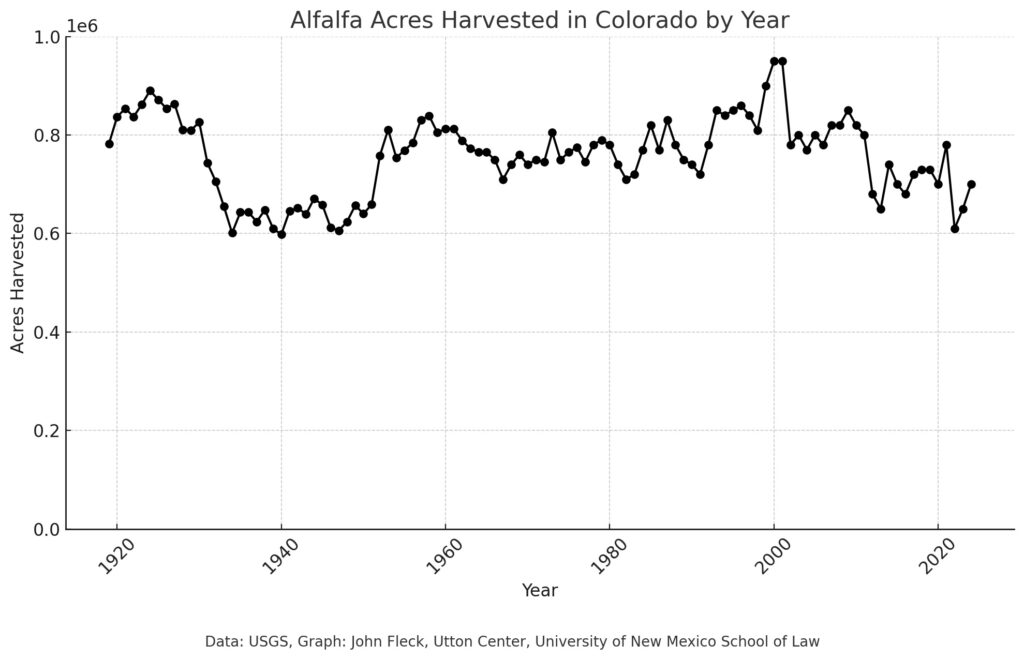
Colorado

Leave a Reply

Your email address will not be published. Required fields are marked *