
Bouncing along the bottom.
Sept. 30 marks the end of the “water year,” an accounting milestone that gives us an opportunity to take stock.
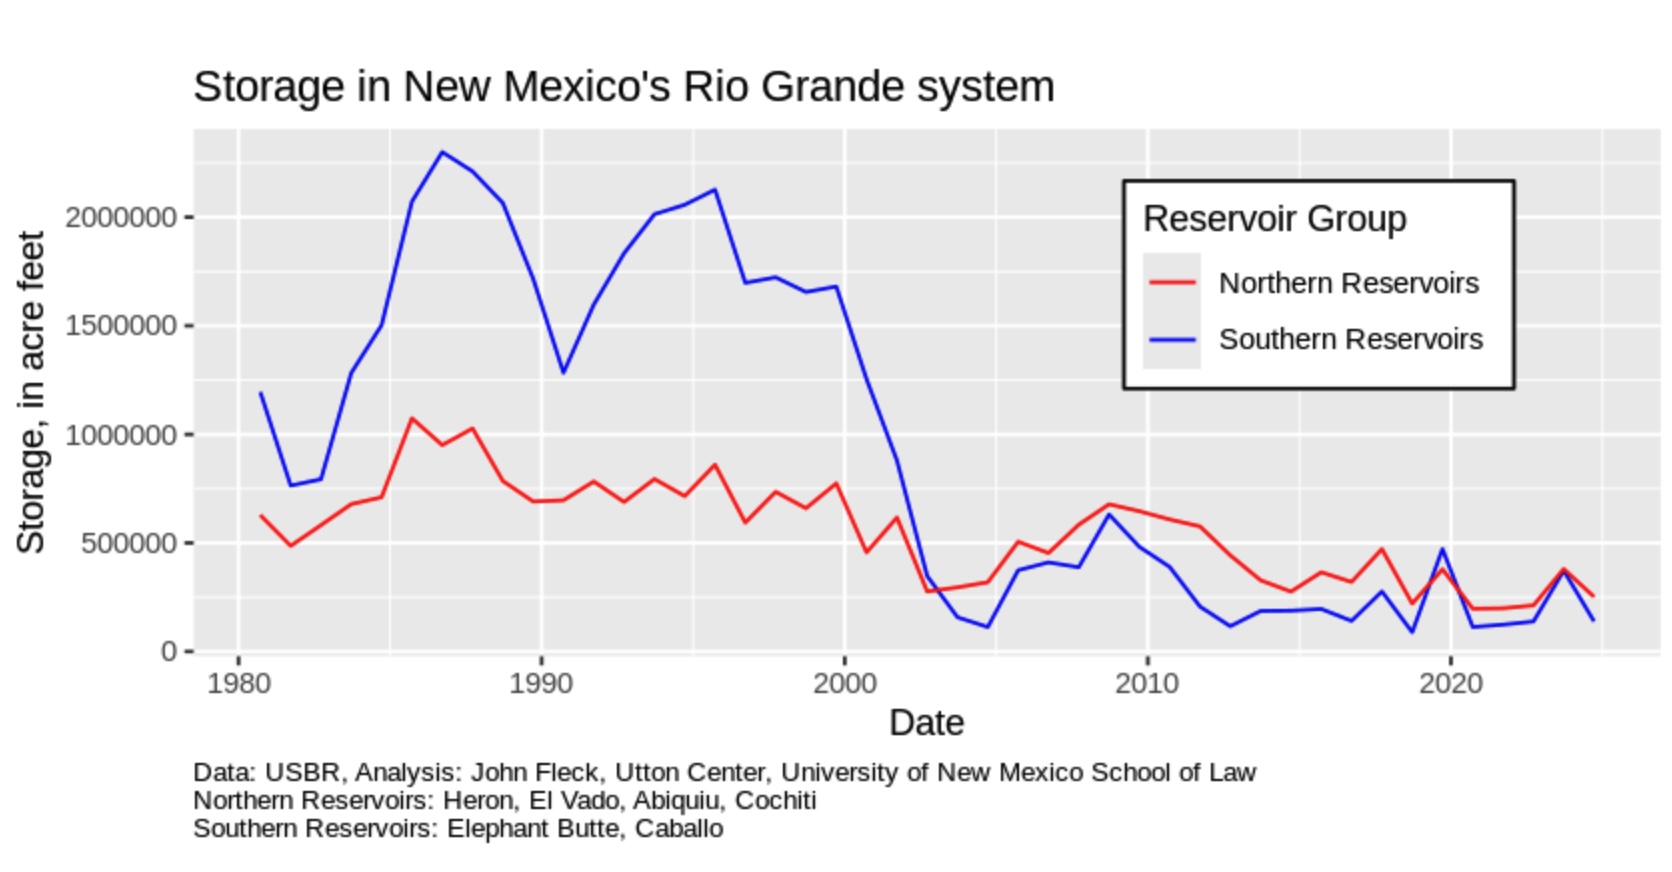
The change in total water storage year-over-year is one way to do this, to help understand if we took more water out of the reservoirs than the climate put in. The graph above is actually based on Sept. 20 year-over-year (the Reclamation data updates lag a bit), but it’s enough to give us a feel for two things.
First, we’ve seen no real reversal of the long term pattern – a huge reduction in storage in the early 21st century, and then basically dragged the bottom of the reservoirs ever since.
Second, on a shorter one- or two-year time scale, total storage is down ~350,000 acre feet at the end of water year 2024 compared to the end of 2023. Over a two-year time scale, we basically burned through the bonus water from a wet 2023 and are back where we were at the end of 2022.
Rio Grande flow this year at Otowi in north-central New Mexico has been 63 percent of the period of record mean, going back to the late 1800s.