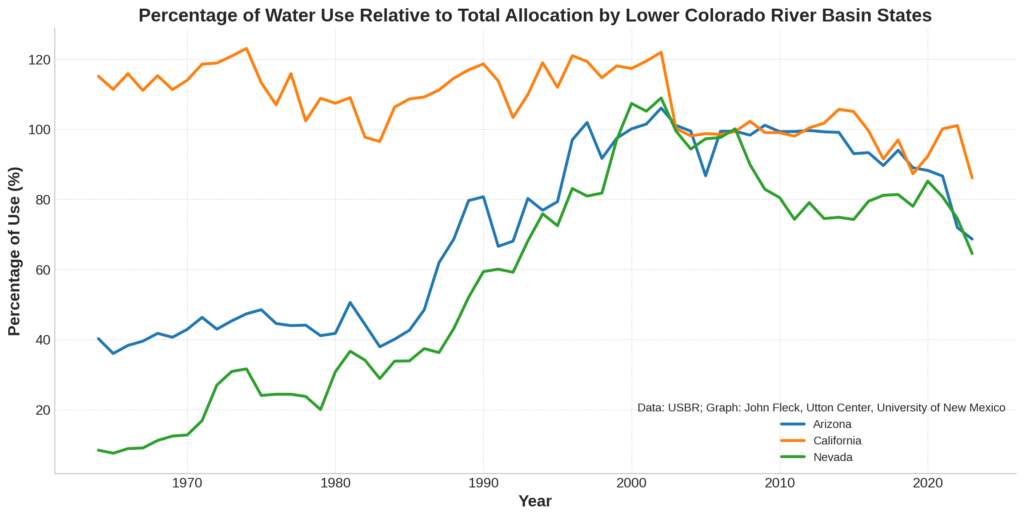
I’ve emerged from my cozy book writing cave (The new book’s going well, thanks for asking!) to some stunningly optimistic Lower Colorado River Basin water use data.
Forecast use in 2023 (based on the Sept. 18 USBR forecast model) has dropped below 6 million acre feet, currently just 79 percent of the total baseline Lower Basin allocation of 7.5 million acre feet. Californians are on track for their lowest take on the river since 1949, according to my crazy stitched-together dataset (USBR decree accounting reports plus pre-1964 numbers assembled some time ago by some folks at MWD).
Arizona and Nevada’s use is the lowest its been since 1992.
Relative to their baseline allocations, Arizona (at 69 percent) and Nevada (at 65 percent) are still doing the heaviest lifting, but California (at 86 percent) is seriously pitching in too.
| State/Total | 2023 Use (acre-feet) | % of Total Allocation | Last Year Use Was This Low |
|---|---|---|---|
| Arizona | 1,921,944 | 68.64% | 1992 |
| California | 3,788,609 | 86.10% | 1949 |
| Nevada | 193,599 | 64.53% | 1992 |
| Total US Lower Basin | 5,904,152 | 78.72% | 1984 |
Because bits are cheap, here’s the full dataset back to 1964. Source is the USBR’s Water Accounting reports, with a huge thanks to Sami Guetz at UCSD for help earlier this year QA’ing the numbers:
| year | Arizona | California | Nevada | total |
| 1964 | 1,127,176 | 5,064,733 | 25,297 | 6,217,206 |
| 1965 | 1,008,531 | 4,899,987 | 22,716 | 5,931,234 |
| 1966 | 1,073,055 | 5,096,912 | 26,656 | 6,196,623 |
| 1967 | 1,106,894 | 4,886,734 | 27,190 | 6,020,818 |
| 1968 | 1,169,240 | 5,072,533 | 33,614 | 6,275,387 |
| 1969 | 1,138,085 | 4,896,527 | 37,392 | 6,072,004 |
| 1970 | 1,201,441 | 5,015,018 | 38,308 | 6,254,767 |
| 1971 | 1,296,930 | 5,216,300 | 50,586 | 6,563,816 |
| 1972 | 1,203,043 | 5,230,635 | 81,051 | 6,514,729 |
| 1973 | 1,268,744 | 5,317,547 | 92,649 | 6,678,940 |
| 1974 | 1,325,631 | 5,414,040 | 94,889 | 6,834,560 |
| 1975 | 1,358,003 | 4,983,705 | 72,140 | 6,413,848 |
| 1976 | 1,248,020 | 4,706,594 | 73,192 | 6,027,806 |
| 1977 | 1,231,274 | 5,097,343 | 73,174 | 6,401,791 |
| 1978 | 1,234,942 | 4,503,340 | 71,293 | 5,809,575 |
| 1979 | 1,150,853 | 4,788,423 | 60,074 | 5,999,350 |
| 1980 | 1,169,657 | 4,725,496 | 92,426 | 5,987,579 |
| 1981 | 1,415,850 | 4,795,949 | 110,017 | 6,321,816 |
| 1982 | 1,240,384 | 4,299,799 | 102,326 | 5,642,509 |
| 1983 | 1,062,169 | 4,245,045 | 86,596 | 5,393,810 |
| 1984 | 1,122,399 | 4,677,103 | 101,492 | 5,900,994 |
| 1985 | 1,194,208 | 4,778,749 | 101,709 | 6,074,666 |
| 1986 | 1,356,930 | 4,803,676 | 112,217 | 6,272,823 |
| 1987 | 1,734,172 | 4,891,961 | 108,863 | 6,734,996 |
| 1988 | 1,922,737 | 5,039,679 | 129,420 | 7,091,836 |
| 1989 | 2,229,967 | 5,144,417 | 156,213 | 7,530,597 |
| 1990 | 2,260,272 | 5,219,457 | 178,111 | 7,657,840 |
| 1991 | 1,864,360 | 5,005,595 | 180,224 | 7,050,179 |
| 1992 | 1,906,071 | 4,546,192 | 177,551 | 6,629,814 |
| 1993 | 2,246,695 | 4,835,017 | 204,402 | 7,286,114 |
| 1994 | 2,152,410 | 5,234,088 | 227,542 | 7,614,040 |
| 1995 | 2,221,346 | 4,925,480 | 217,439 | 7,364,265 |
| 1996 | 2,714,754 | 5,322,652 | 249,248 | 8,286,654 |
| 1997 | 2,853,886 | 5,250,119 | 242,777 | 8,346,782 |
| 1998 | 2,566,707 | 5,045,228 | 245,303 | 7,857,238 |
| 1999 | 2,727,960 | 5,194,380 | 291,130 | 8,213,470 |
| 2000 | 2,802,758 | 5,162,211 | 321,984 | 8,286,953 |
| 2001 | 2,841,028 | 5,254,718 | 315,429 | 8,411,175 |
| 2002 | 2,969,230 | 5,365,609 | 326,718 | 8,661,557 |
| 2003 | 2,830,599 | 4,408,746 | 298,392 | 7,537,737 |
| 2004 | 2,784,645 | 4,316,185 | 283,006 | 7,383,836 |
| 2005 | 2,428,469 | 4,344,258 | 291,778 | 7,064,505 |
| 2006 | 2,782,866 | 4,335,299 | 292,864 | 7,411,029 |
| 2007 | 2,783,323 | 4,370,695 | 300,312 | 7,454,330 |
| 2008 | 2,752,497 | 4,498,810 | 269,654 | 7,520,961 |
| 2009 | 2,831,711 | 4,358,074 | 248,613 | 7,438,398 |
| 2010 | 2,780,367 | 4,356,839 | 241,437 | 7,378,643 |
| 2011 | 2,781,108 | 4,312,661 | 222,847 | 7,316,616 |
| 2012 | 2,789,667 | 4,416,718 | 237,161 | 7,443,546 |
| 2013 | 2,778,867 | 4,475,789 | 223,563 | 7,478,219 |
| 2014 | 2,774,661 | 4,649,734 | 224,616 | 7,649,011 |
| 2015 | 2,604,732 | 4,620,756 | 222,729 | 7,448,217 |
| 2016 | 2,612,833 | 4,381,101 | 238,326 | 7,232,260 |
| 2017 | 2,509,503 | 4,026,515 | 243,425 | 6,779,443 |
| 2018 | 2,632,260 | 4,265,525 | 244,103 | 7,141,888 |
| 2019 | 2,491,707 | 3,840,686 | 233,996 | 6,566,389 |
| 2020 | 2,470,776 | 4,059,911 | 255,568 | 6,786,255 |
| 2021 | 2,425,736 | 4,404,727 | 242,168 | 7,072,631 |
| 2022 | 2,014,176 | 4,445,255 | 223,670 | 6,683,101 |
| 2023 | 1,921,944 | 3,788,609 | 193,599 | 5,904,152 |


The difference between median values and ’23 (to date) is not much. Mean, too, pretty close. EXCEPT California! -26% IF I got that about right? What happened there? More GW pumping? Wet winter? If it’s just weather, not much to get excited about?
Thanks, Craig
Thx John :
Useful data.
Bill
Data can set you free.
Alan Mulally