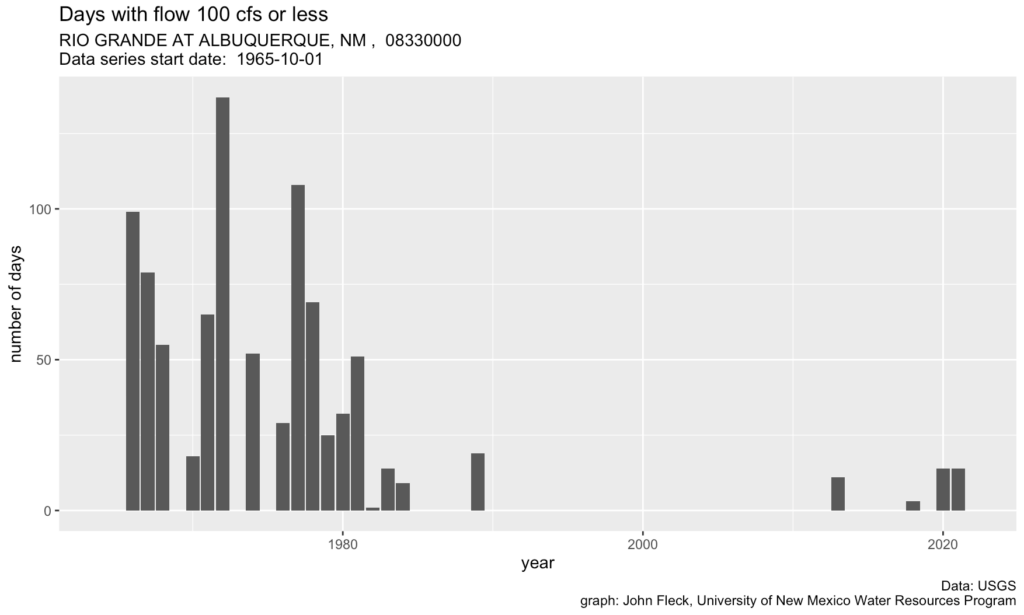
One measure of dryness on the Rio Grande
I’ve been thrashing about this year thinking about ways of visualizing and measuring how dry this year has been on my home river, the Rio Grande through Albuquerque. Above is my latest stab at it.
A flow of 100 cubic feet per second at the USGS gage at Albuquerque’s Route 66 bridge in the middle of town has always been a threshold I watch. That’s in part because for a time it was used as a criteria for Endangered Species Act compliance (no more), and in part because when it drops that low it just looks dry – a shallow braided channel meandering through muddy sand.
This particular bit of code counts the days each year below a specified threshold, and the graph above was created by setting that to 100 cfs.
The flows here are a combination of climate-driven inflows and human management. All those dry days back in the 1960s, ’70s, and ’80s were driven in significant part by river management – much larger diversions from the river for irrigation. The relative lack of dry days across much of the 21st century was also driven by river management – an ESA requirement to keep the river wet here.
In both cases that combines with hydrology.
Unfortunately we only have data for the Route 66 bridge gage since 1965. I’ve got some more work I’m doing (back later for that, gotta get to the day job) looking at other gages with longer records, but the interplay of gage history and diversion points makes that more complicated than I have time for this morning, still ingesting first coffee.
Yesterday was the 14th day this year with a daily average flow less than 100 cfs. Last year we had 14 such days. The last time we had more was 1989.
Flow this morning, as I write this, is < 80 cfs.

So . . . the 1970s were much dryer than today? I guess you are saying this is a result of ESA regulation? Sorry, I’m on my 1st cup of coffee.