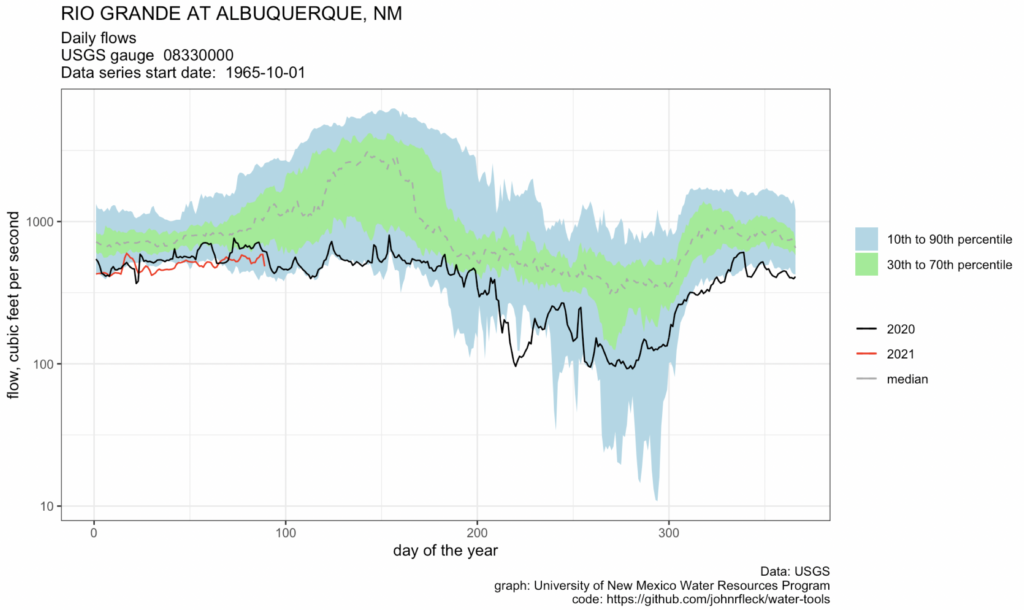
Flow so low I needed to switch to log scale
I mostly hate log scale in graphs I use for broad communication purposes. It’s just not intuitive.
But I’ve made the switch for this year’s Rio Grande, because the flows are so low that we need the log scale, because at really low flows small changes become big, if that makes any sense. The difference between 50 and 150 cubic feet per second through Albuquerque is hugely consequential for the our river. Best to have a visual display that highlights that.

Flows should start rising this week and continue that way into May. Tusas mtn snows are definitely melting off now.