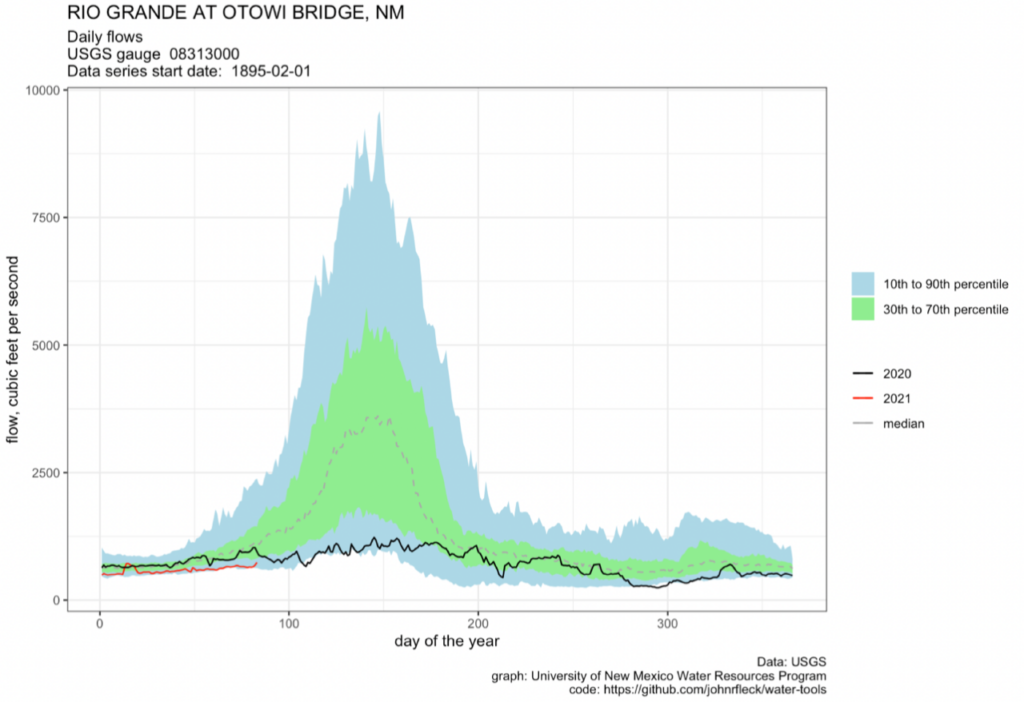
An email exchange with a friend who helps manage New Mexico’s water led to the graph above, my first stab at a visualization to try to show the accumulation of two bad years’ flow on the Rio Grande. Not quite sure this does all the work yet that I need of it, but perhaps worth sharing….
