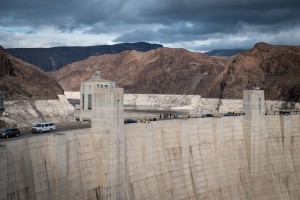
The U.S. Bureau of Reclamation’s monthly report forecasting Colorado River Basin reservoir operations for the next 24 months (pdf) came out today, and it had some good news and some bad news for people in the Lower Colorado River Basin worried about dropping levels in Lake Mead.
Mead ended February at a surface elevation of 1,089 feet above sea level, which is just 41 percent full, the lowest it has been at this time of year since they first began filling it in the 1930s. If it drops much further (1,075), Arizona and Nevada will have to reduce their use of Colorado River water, the first shortage since the system was built.Good news: We’re all but guaranteed at this point (a 95 percent chance) that there the Bureau of Reclamation will release some “bonus water” from Lake Powell to help keep Mead’s levels from dropping further. Under normal operations, the rules require upstream states to release 8.23 million acre feet per year*, but this year the likely release will be 9 million acre feet.
Bad news: Despite the extra water, Mead is forecast to continue dropping – another 6 feet at the end of September compared to a year previous. How could that be?
The answer is what some people are calling the “structural deficit” (though I’ve gotten some pushback on the term). The basic rules that govern water accounting call for normal deliveries to Nevada, Arizona, California, and Mexico that, when combined with evaporation and system losses as the water moves downstream, are greater than the amount of water available:
In the past, water users were able to ignore this problem because “bonus water” above and beyond the minimum 8.23 million acre feet was routine. But because of unprecedented drought (climate change?), the bonus water is gone. Despite the drought, the Upper Basin states have continued to meet their 8.23 million acre foot base requirement, but the days of bonus water are gone.
It seems obvious that the folks downstream would look at this situation and say, “Hey, we’ve got to stop using so much water!” And they have, to a point. In 2007, they signed a shortage sharing agreement that calls for a reduction in Arizona and Nevada’s share if Lake Mead drops below 1,075. The idea here is that they use the water while they’ve got it, and then cut back when the reservoir drops to troublingly low levels.
When basin leaders were hashing out the details of the 2007 agreement, they considered options that would have cut use sooner deeper, and sooner, but they didn’t do it, so this is where we are now.
* Lawyers will argue about this number, but for all practical purposes, that’s the way the system’s being operated.


Hi, John.
Thanks for such a useful and clear post. A question: How many years of data comprise the structural deficit chart above? Is that one typical recent year, or the average over lots of years? To ask it differently, is there a chart that shows historic lower basin uses and losses (the “out”) against the delivery (the “in”) which reveals when we settled into the the deficit era?
Sam
John, what are some examples of “system losses?”
Do you happen to know the breakdown between evaporation and system losses?
Sam – Great question, I need be more clear, don’t I? The data shown is 2015, a single year. It’s typical of any year in which there is no surplus delivered from upstream. I’ll try to find a reasonable way to convey the history with a dataset and do a post at some point soon.
David – Don’t know evap/vs system losses, but I’ll hunt for it.
Hi John. I couldn’t get this evaporation question out of my mind. I found this study:
“Evaporation from Lake Mead, Nevada and Arizona, March 2010 through February 2012”
By Michael T. Moreo and Amy Swancar
Scientific Investigations Report 2013-5229
http://pubs.usgs.gov/sir/2013/5229/
which says Lake Mead lost 548,000 acre-feet to evaporation in each of the 12 months periods from March 2010 to Feb 2012.
Looking up the average volume and surface area for these two years, and If I did my math correctly, I find the evaporation rate to be about 2.0 meters/year, or 5.4 mm/day. That represents about 5% of the Lake’s volume (5.4% in the first year, 4.5% in the second; the difference is due to the different Lake elevations of 25 feet (higher in the second year). Likewise, the evaporation rates were 2.1 and 1.9 m/yr. I’ve excluded the slight changes in the Lake’s area and volume as the water level changes).
I see elsewhere that evaporation rates are typically 3-5 mm/day, but I never would have guessed that would be as high as 1/20th of the Lake’s volume per year.
PS: The average Lake depth for these two years were 38 meters and 42 meters respectively. Lower than I would have guessed.
David – Thanks, I hadn’t seen that USGS report. A couple of grad students at UNM are working with me on some modeling of the system, it will help us. And we’ll soon have some good longer time series data on this. One of the impacts of lower lake levels is reduced evap losses because of reduced surface area.