Colorado River Basin, Courtesy Scripps Inst. of Oceanography
With La Niña rapidly strengthening, it is reasonable to ask what can be said about the resulting effect on flows in the Colorado River. The short answer: not much.
It is reasonable to guess otherwise, because so much of the southwest depends on the Colorado for its water supply, and because La Niña is so well known as a bringer of drought in the southwest. But the important fact here is that La Niña’s strongest effect is found in the southern part of the basin, while most of the Colorado River’s water comes from the northern part of the basin.
You can see from the map above that the Colorado River Basin stretches across mountainous western Colorado and into Wyoming. The vast majority of the Colorado’s flow falls in the area colored green on the map, which very little contribution from the desert rivers of the lower basin (the brown bits). For all practical purposes, the flow measured at Lee’s Ferry defines the available water on the Colorado system, which is why that was the point chosen for dividing the river’s water under the Colorado River Compact.
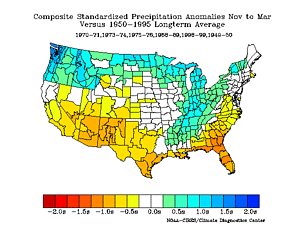
As you can see from map number two, La Niña’s effect on precipitation is far greater to the south, and less to the north. This is Nov-March precip, which is the snowpack season and captures the key climatological period in terms of both water supply development and also La Niña’s effect. The color scheme represents standardized precipitation anomalies in standard deviations from the mean during La Niña years. The main message is that yellow is a little drier than average, browns are a lot drier, and Florida and southern Georgia are screwed. But that’s the subject of another blog post.
But we’re really interested here in water in the river, not rain and snow falling on the ground. The folks at the Colorado Basin River Forecast Center have an excellent, user-friendly collection of data. I look at their estimates of naturalized Lee’s Ferry flow (what it would have been if not for upstream dams and diversions). What it shows is that there is almost zero correlation whatsoever between the El Niñ0-La Niña condition (ENSO) and flow on the Colorado River. Here, for example, is April – July streamflow (the months when the vast majority of the water is coming off) compared to sea surface temperature in the ENSO 3.4 region, which is the key area for impacting our climate, from Nov-March. You can slice up the data a lot of different ways, but there’s just not much of an effect on average at Lee’s Ferry:
ENSO and Colorado River Flow, courtesy CBRFC
(A big thanks to Kevin Werner at the CBRFC for helpful discussion today about this issue.)


I can say here in our basin that we’ve seen nary a drop of rain for almost 8 weeks now. She’s cranking up and we are duh-rye in these here parts. Correlation? We report, you decide.
Best,
D
Pingback: River Beat: The Myth of a Busted La Niña Forecast : jfleck at inkstain