The question of how much it rained or snowed is an important one in water management, but answering it is not trivial. The answer depends on a mix of remote sensing data, radar and rain gages (often data collected by volunteers).
I got a helpful note yesterday from Jeff Lukas about a western precipitation map I used in a post last weekend. Turns out the map, which I pulled from this NOAA web site, may be underestimating high mountain precipitation in the Colorado Basin because of the methodology used to turn the disparate data into a map. (Jeff does climate product assessment at the Western Water Assessment.) The map’s basic message – dry in the Colorado River Basin as compared with points east – is basically the same, but Jeff points out that the actual situation is not as dire as the map I posted suggested.
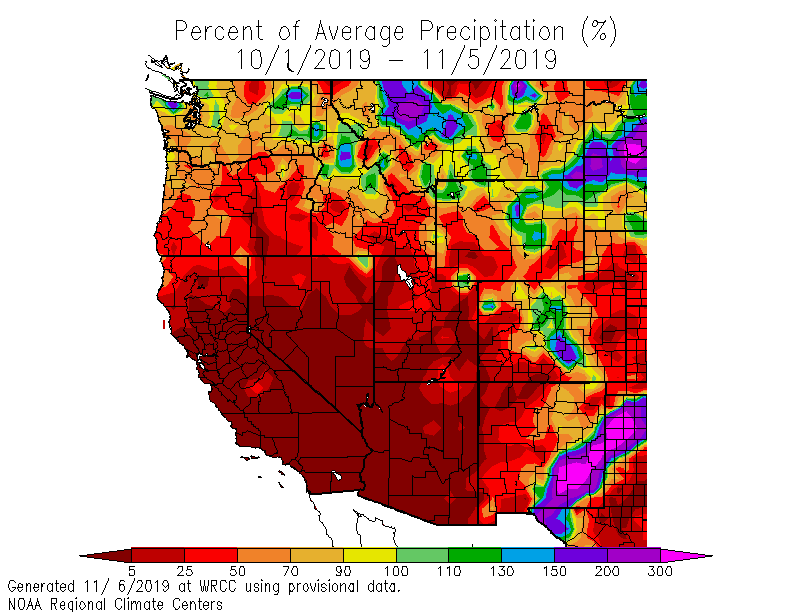
Here, thanks to Jeff, are a couple of better ones. First, from COOP rainfall reports, a network of volunteer weather observers, with map via the Western Regional Climate Center (image below taken 7/23, updated daily here):
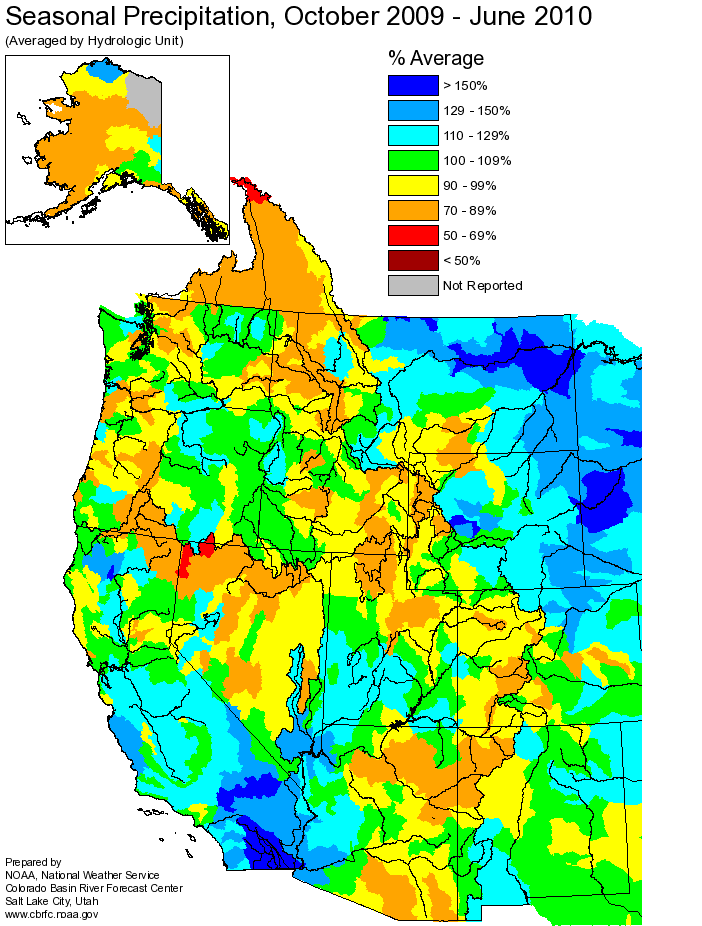
The second is from the Colorado Basin River Forecast Center:


Pingback: River Beat: Some Good News : jfleck at inkstain