My colleague Mike Murphy’s story last week about New Mexico’s historic unemployment rate (sub/ad might be req, I can never tell) got me thinking about how we measure our economic ills, and how we compare to others around us. A couple graphs. In both cases I’ve chosen Nevada (red) as our comparison state because I’m headed there next month to learn some more about their water situation, so I’m all about trying to understand Nevada better.
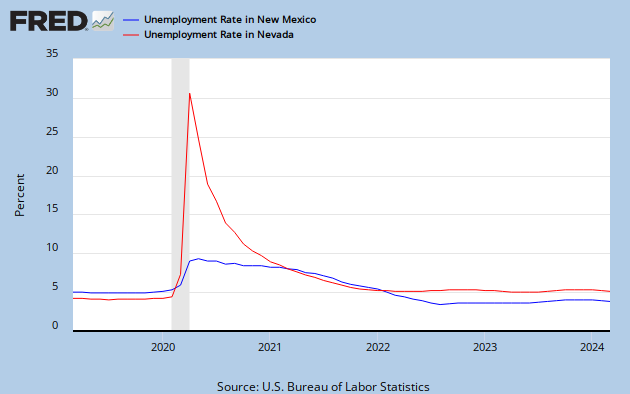
First, unemployment:
In other words, it could be a lot worse.
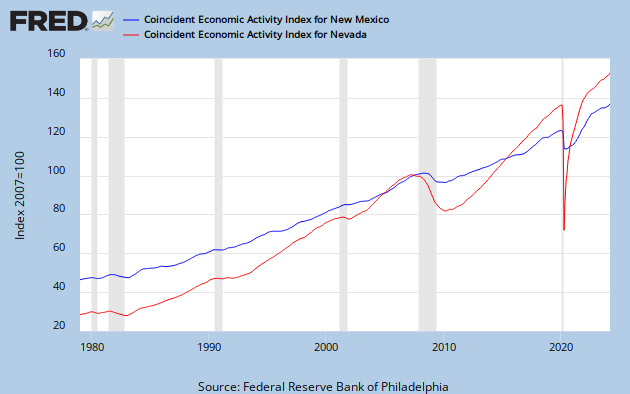
Second up, same two states, an indicator called “coincident economic activity,” which bundles up a bunch of separate economic measures into a single index to help track state-by-state comparisons. (More on what’s in the number here.)

Nevada, New Mexico coincident economic index, courtesy St. Louis Fed
I guess if you don’t go up so much, you don’t have as far to fall, or something.


I first heard this near Abiquiu in 1970: “The Great Depression hit Northern New Mexico earlier than the rest of the country, and never left.”