Pasadena, CA, blogger Wayne Lusvardi, who sometimes writes about that city’s water problems, had a post recently suggesting that global warming might lead to increased flows in the Colorado River.
This would, of course, be excellent news for Pasadena and others who use Colorado River water (thought it does conflict with some of the literature – see for example here, here, here, here, here, here, here, here, here, here, here, here and here). So it’s worth looking at how Wayne arrived at his conclusion.
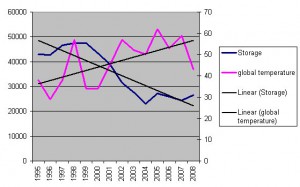
As it happens, he’s using some data I assembled recently from the U.S. Bureau of Reclamation on storage in Lake Powell and Lake Mead, the two big main stem reservoirs on the Colorado River. Comparing my graph to a graph of global temperatures since 1995, Wayne said… Well, I’ll let him explain:
There appears to be a rough correlation between global warming and more water storage along the Colorado River.
Wayne did this by eyeballing my graph and a 1995-present global temperature graph. I’m not sure where he got the temperature data, but since I’ve got the data for the first graph, and NASA’s GISS data is easily available, I took the step of overlaying global temperature and Colorado River storage on the same graph, just to make the eyeballing easier. As a bonus, I added linear trend lines to make it easier to see the painfully obvious.
The temperature data is the anomaly from the 1951-80 base period. The storage number is total acre feet of water in Lakes Mead and Powell combined. Now, I would not begin to argue this is a reasonable way of evaluating the question. Total storage depends on both annual inflow as well as consumptive use in the seven basin states. In addition, each year’s storage data is significantly dependent on the amount of storage in the system the previous year.

But let’s just take Wayne’s methodology on its face and see if there’s anything to the argument he is making anyway. Hmmm. Looks like the data seem to be doing rather the opposite of what Wayne seems to be suggesting. As temperature rose, storage went down. A little mathemagic shows, in fact, that the correlation is negative. This should be obvious. Temperature has been going up. Colorado River storage has been going down. It’s in no way statistically significant, but if you want to make the argument Wayne offers up, it’s worth noting that such an argument comes to the opposite conclusion. Gotta follow the data where they lead, Wayne!
But perhaps I’m not being fair. As Wayne said, “The charts … are only suggestive and should not be construed as valid science.” Thank goodness for that.

Is the storage going down because less water flows in the river each year; or is the storage going down because more water is used by the fast-growing cities in the southwest?
Both.
Good man. Keep it real.
Well done. Good exposition/demolition.