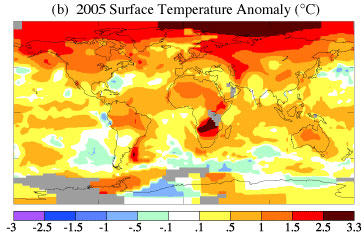
The various analyses of global surface temperature are up for 2005. Realclimate has a rundown. The map from the NASA GISS folks is instructive:

By the GISS measure, 2005 is the warmest year since reliable temperature measurements have been available. By the measurement of the World Meteorological Organization and Climatic Research Unit group in the UK, it’s the second warmest year gobally in history (MSWord document).
Roger Pielke Sr. has some comments questioning the numbers. Given that I don’t really understand his wind and warm bias argument, I’ll pass on that one. But he also questions the sparseness of data. I’d be curious about his comments on Duffy et al.’s conclusion that the sparseness is likely to cause an underestimate of the surface temperature warming, rather than an overestimate.
For those who would like to revisit the question of whether the numbers merely reflect warming in cities where the thermomenters are located, I’ll refer you to Hansen and Ruedy, wherein the urban corrections used in the GISS data are discussed.
As for the monthly debate over whether globally averaged surface temperature is of any relevance, I’ll refer y’all to the map I cribbed above. I’d agree that a single global number isn’t terribly meaningful except as a sort of abstract marker for we journalists to hang a headline on. But the regional variability is of some use to those of us ’round the world curious about what’s happening where we live. And I’ll remind y’all that the planet’s surface is, after all, where we live. You’ll note that Michael Crichton’s going to have to work hard hard to get his fictional characters to the few spots on the globe that were cooler this year than the 1951-1980 average. Looks like they’ll need a boat, which is actually not a problem, since it’s fiction. He can just conjure one up.
