This is Delph Carpenter, speaking Nov. 12, 1922, ad the twelfth meeting of the Colorado River Commission:
The hydrographers and experts advise me that a twenty-year record on a river is adequate in its completeness and includes enough years to warrant an assumption that the average there deduced would be the average flow of the river in the future.
How wrong he was.

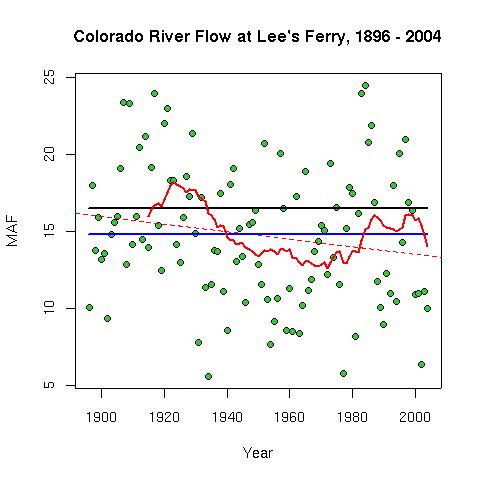
The green dots represent the Colorado River’s flow at Lee’s Ferry (adjusted to represent the flow if the river would have been undammed). The black line is the amount the commission assumed based on the available river data – about 20 years’ worth. The blue line is the actual long-term average since 1896. And the red jiggly line is the rolling 20-year average, positioned at the end of the 20 year interval. You can see it’s highest in the early 1920s – at about the time the commission was meeting in Santa Fe. (data from the Upper Colorado River Commission)
Carpenter and the other commissioners thought that a sufficiently long period – perhaps ten years, but certainly twenty – should be sufficient to average out the ups and downs of long-term climate cycles in the west. You can see they were quite wrong.
