It’s all fun and games until you actually have to measure snow.
The US Bureau of Reclamation’s first 2012 Colorado Basin reservoir forecast (the “24-month study”, pdf) projects a decline in total storage in lakes Mead and Powell, the Colorado River’s largest storage reservoirs, of 844,000 acre feet, or 2.76 percent.
There are two ways of framing this.
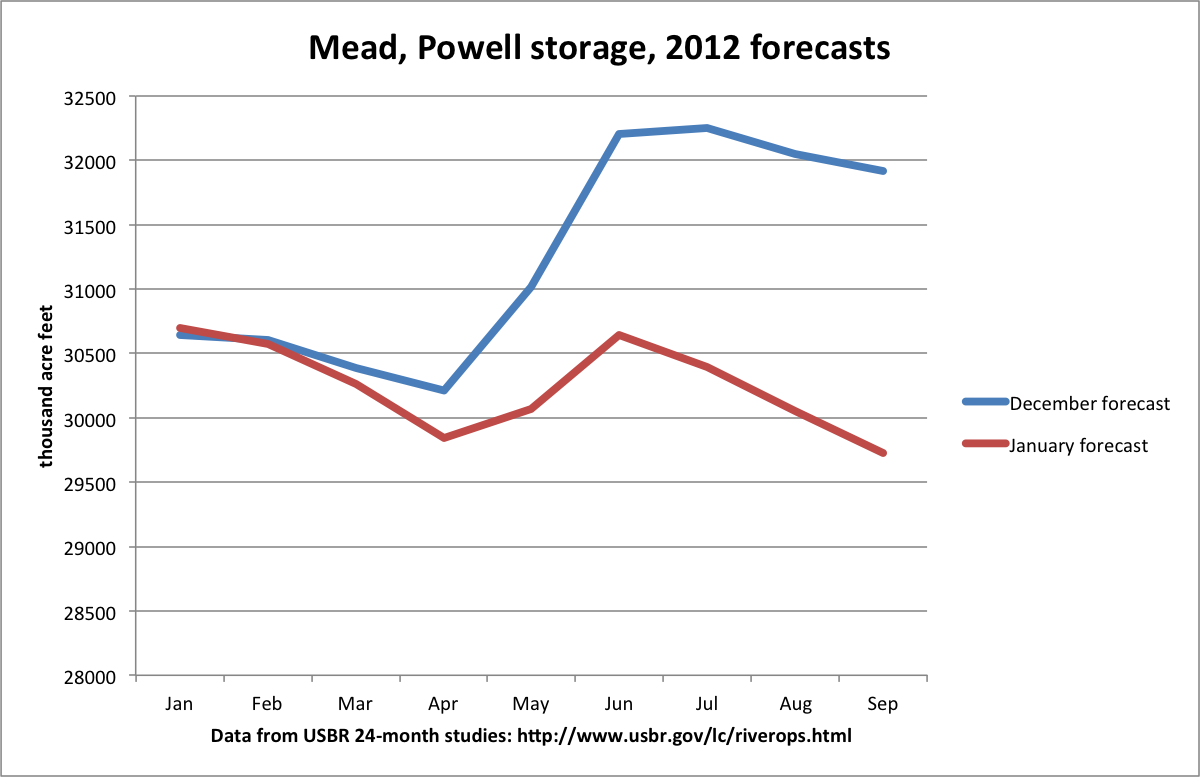
Let me start with the pessimistic, illustrated by this graph comparing the December and January projections. The December projection is based on no real forecast at all, but rather what amounts to an assumption of normal snow. There’s nothing wrong with this. That early in the season, the water managers have no idea what to expect, and they’re not making decisions based on the forecasters, so you could think of it as a placeholder. The January forecast is based on the first real numbers, which show a paltry snowpack in the upper basin – 66 percent (by one measure, the Colorado Basin Forecast Center’s aggregation of snow measurement sites upstream of Lake Powell) as of the date the forecast was made. The blue line is the December forecast, the red line is January once actual snowpack for the years is factored in. It’s down 2.2 million acre feet. But since that time, there hasn’t been much snow. The CBRFC Powell group today (Sat. 1/14/12) is down to 58 percent of average. Don’t put too much stock on the specific percentages (Danger! Amateur using Snotel!), but rather look at the trend. It’s down. With the forecast favoring dry through the end of the month, it’s reasonable to expect the projections to drop.
That’s the pessimistic frame.
Here’s the optimistic frame.
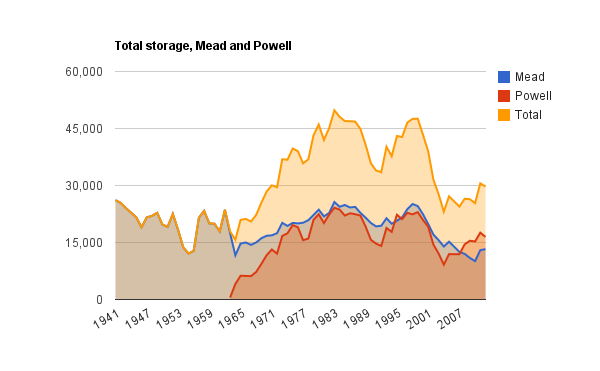
While an 844,000 acre foot drop is a lot of water, last year the total storage in the two reservoirs rose by 5.2 million acre feet. It would take six consecutive years of drops of the size currently projected for 2012 to wipe out the gains from last year’s bounty. From 2000-2010, during the Drought of the ’00s, the reservoirs averaged a 2 million acre foot per year drop. 844kaf is not a big number in that context.
Here’s my total storage graph, updated with the end-of-water year 2012 estimate from the latest 24-month study:
What do you think? Which frame is “right”?


